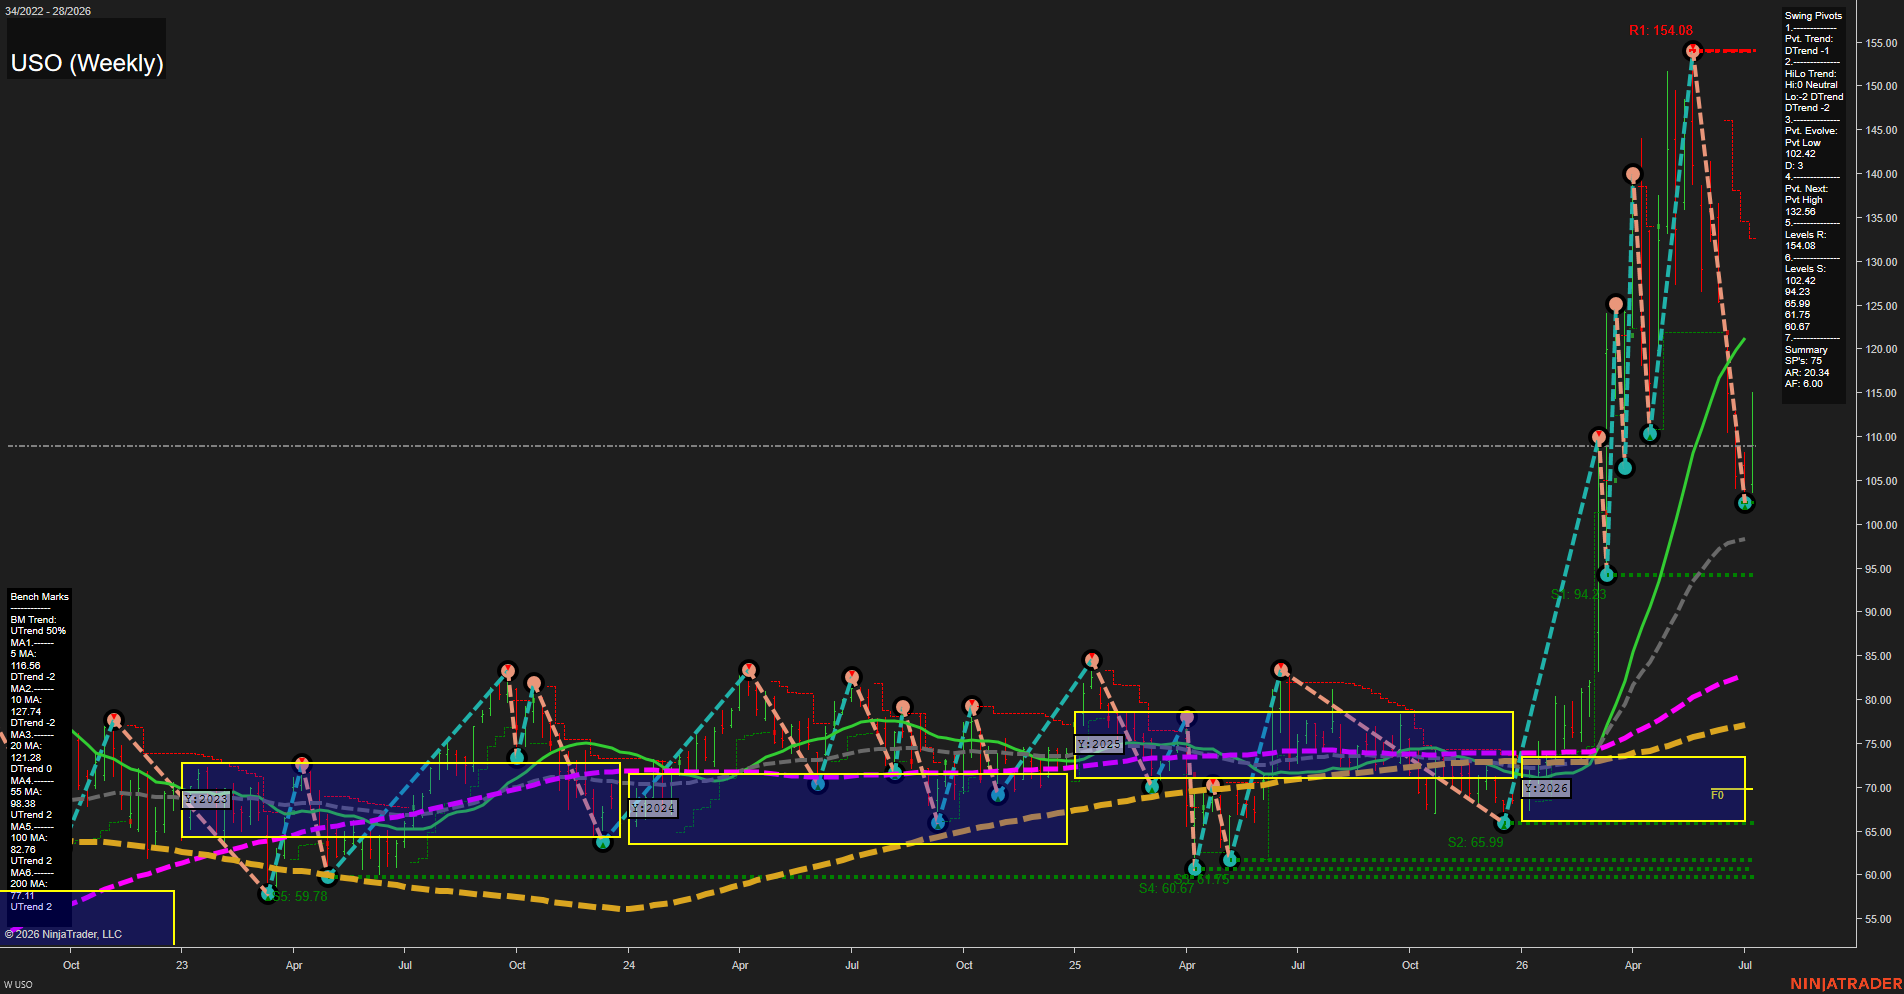
USO United States Oil Fund LP Weekly Chart Analysis: 2026-Jul-10 07:08 CT
Price Action
- Last: 102.42,
- Bars: Large,
- Mom: Fast.
WSFG Weekly
- Short-Term
- WSFG Current: NA%
- F0%/NTZ' Bias: Price Neutral,
- WSFG Trend: Neutral.
MSFG Month Jul
- Intermediate-Term
- MSFG Current: NA%
- F0%/NTZ' Bias: Price Neutral,
- MSFG Trend: Neutral.
YSFG Year 2026
- Long-Term
- YSFG Current: NA%
- F0%/NTZ' Bias: Price Neutral,
- YSFG Trend: Neutral.
Swing Pivots
- (Short-Term) 1. Pvt. Trend: DTrend,
- (Intermediate-Term) 2. HiLo Trend: DTrend,
- 3. Pvt. Evolve: Pvt Low 102.42,
- 4. Pvt. Next: Pvt High 132.58,
- 5. Levels R: 154.08,
- 6. Levels S: 102.42, 94.23, 65.99, 61.75, 60.67.
Weekly Benchmarks
- (Short-Term) 5 Day: 116.56 Down Trend,
- (Short-Term) 10 Day: 127.74 Down Trend,
- (Intermediate-Term) 20 Day: 121.28 Down Trend,
- (Intermediate-Term) 55 Day: 98.38 Up Trend,
- (Long-Term) 100 Day: 82.76 Up Trend,
- (Long-Term) 200 Day: 77.11 Up Trend.
Overall Rating
- Short-Term: Bearish,
- Intermediate-Term: Neutral,
- Long-Term: Bullish.
Key Insights Summary
USO is in a sharp weekly pullback from a fast vertical rally into the 150s, with the latest candle landing near 102.42 and marking a new pivot low in the short-term swing structure. The pivot sequence remains in DTrend, while the HiLo trend is also aligned bearish after the recent reversal from the upper swing high at 154.08. Price has fallen back beneath the short and intermediate moving-average cluster, leaving the 5, 10, and 20 day benchmarks in down trends, which fits a corrective phase rather than sustained upside continuation. At the same time, the 55, 100, and 200 day benchmarks still slope upward, so the broader backdrop retains a constructive long-term trend even as the nearer-term cycle has turned choppy and mean-reverting. The session fib structure and recent swing map show a transition from expansion to retracement, with support layers at 94.23 and 65.99 standing out below the current pivot low, while 132.58 remains the next major swing high reference. From a futures swing trader perspective, the chart is best characterized as a strong long-term uptrend undergoing a deep short-term correction after an overextended rally.
Chart Analysis ATS AI Generated: 2026-07-10 07:08 for Informational use only, not trading advice. Terms and Risk Disclosure Copyright © 2026. Algo Trading Systems LLC.