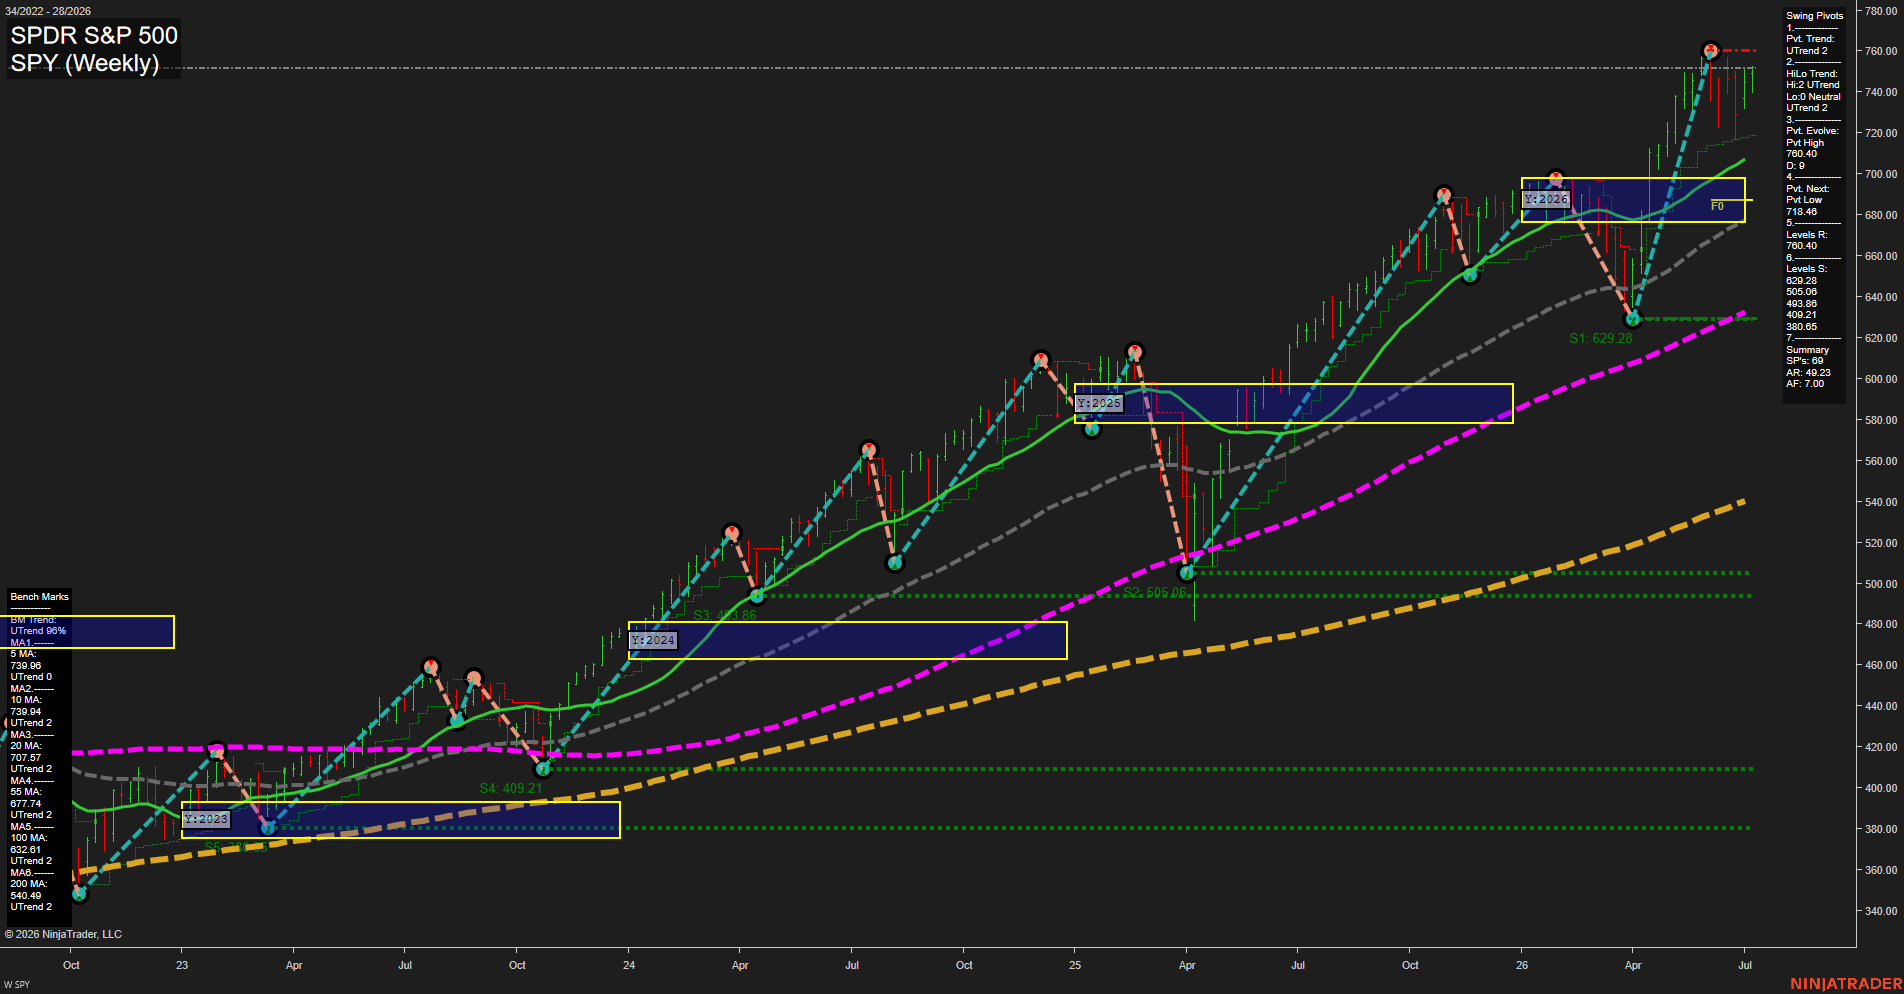
SPY SPDR S&P 500 Weekly Chart Analysis: 2026-Jul-10 07:07 CT
Price Action
- Last: 739.96,
- Bars: Large,
- Mom: fast.
WSFG Weekly
- Short-Term
- WSFG Current: NA%
- F0%/NTZ' Bias: Price Neutral,
- WSFG Trend: Neutral.
MSFG Month Jul
- Intermediate-Term
- MSFG Current: NA%
- F0%/NTZ' Bias: Price Neutral,
- MSFG Trend: Neutral.
YSFG Year 2026
- Long-Term
- YSFG Current: NA%
- F0%/NTZ' Bias: Price Neutral,
- YSFG Trend: Neutral.
Swing Pivots
- (Short-Term) 1. Pvt. Trend: UTrend,
- (Intermediate-Term) 2. HiLo Trend: UTrend,
- 3. Pvt. Evolve: Pvt High 760.40,
- 4. Pvt. Next: Pvt Low 718.46,
- 5. Levels R: 760.40,
- 6. Levels S: 629.28, 505.06, 493.86, 409.21, 380.65.
Weekly Benchmarks
- (Short-Term) 5 Day: 739.98 Up Trend,
- (Short-Term) 10 Day: 739.94 Up Trend,
- (Intermediate-Term) 20 Day: 707.57 Up Trend,
- (Intermediate-Term) 55 Day: 677.74 Up Trend,
- (Long-Term) 100 Day: 632.61 Up Trend,
- (Long-Term) 200 Day: 540.49 Up Trend.
Overall Rating
- Short-Term: Bullish,
- Intermediate-Term: Bullish,
- Long-Term: Bullish.
Key Insights Summary
SPY is in a strong weekly uptrend with price holding near the top of the long advance and sitting above all benchmark moving averages, which are stacked in bullish order. The weekly pivot structure remains constructive with an UTrend reading and a fresh high pivot at 760.40, while the next lower pivot reference at 718.46 marks the nearest completed swing low. The current weekly action reflects a large-range, fast-momentum market after an extended rally, with price pressing into the upper yearly session zone near the 2026 NTZ area. The broader structure shows sustained trend continuation, higher highs, and higher lows across short-, intermediate-, and long-term swings.
Chart Analysis ATS AI Generated: 2026-07-10 07:07 for Informational use only, not trading advice. Terms and Risk Disclosure Copyright © 2026. Algo Trading Systems LLC.