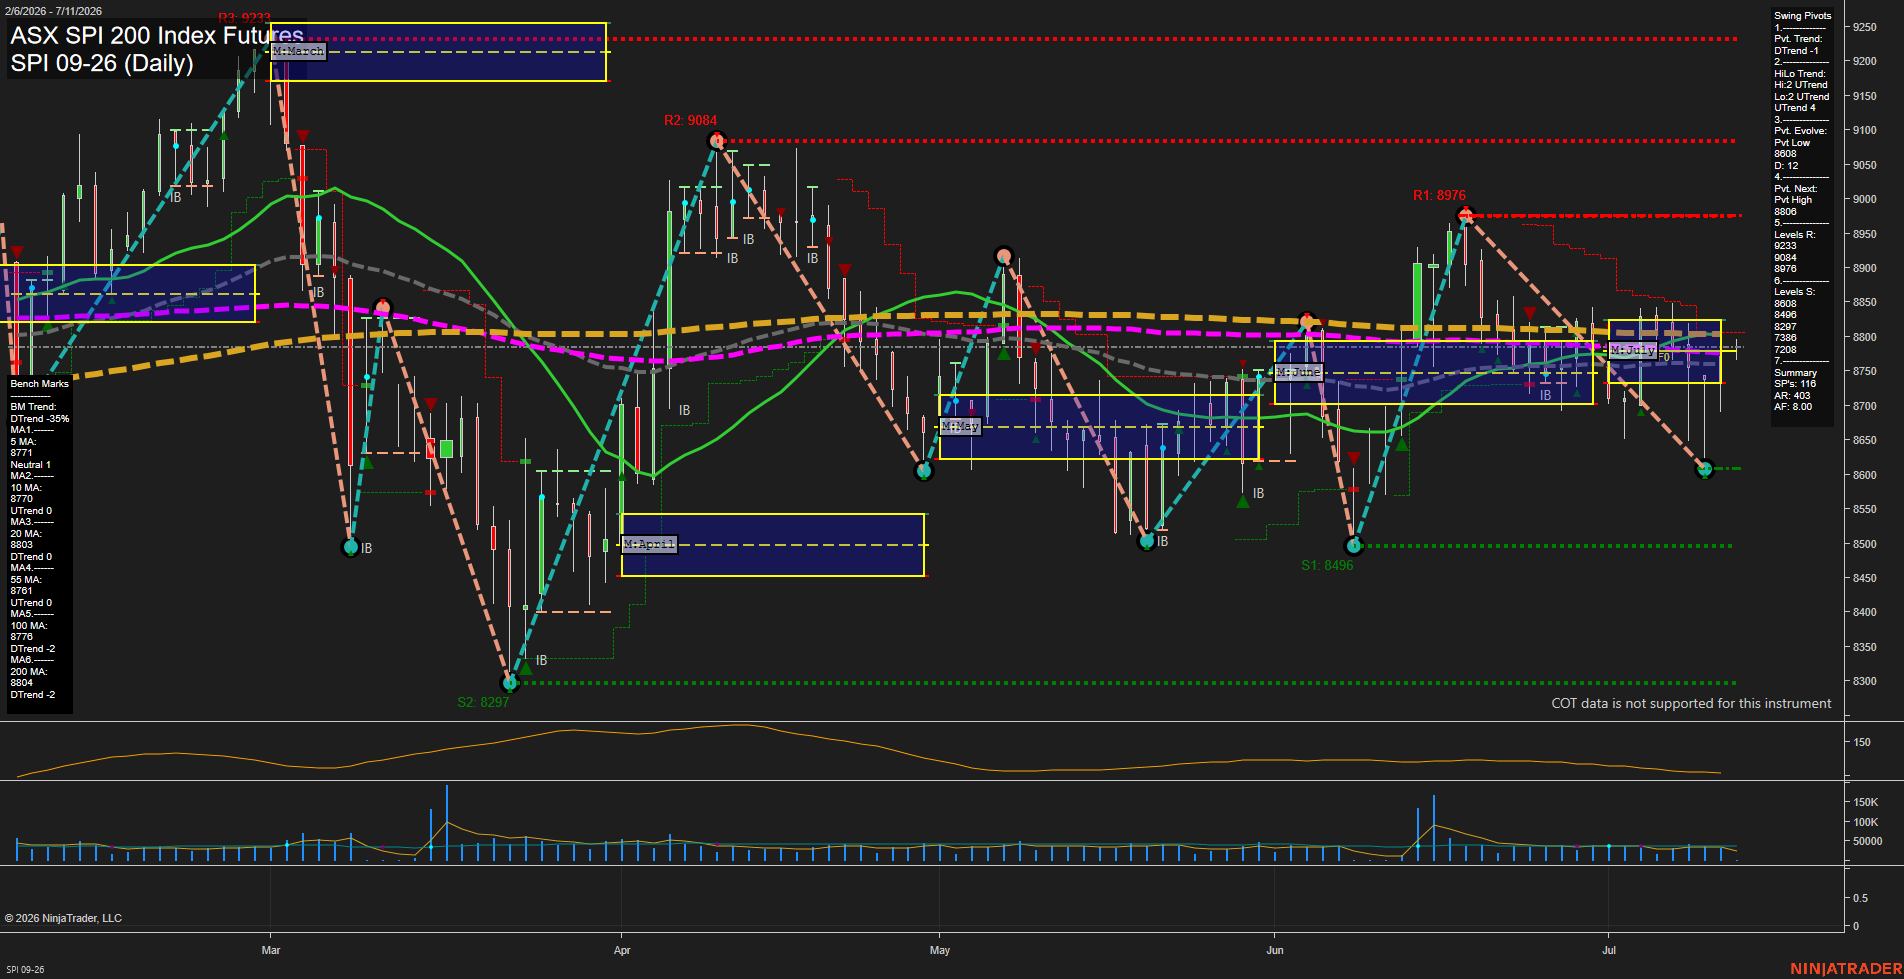
SPI ASX SPI 200 Index Futures Daily Chart Analysis: 2026-Jul-10 07:07 CT
Price Action
- Last: 8780,
- Bars: Medium,
- Mom: slow.
WSFG Weekly
- Short-Term
- WSFG Current: NA%
- F0%/NTZ' Bias: Price Neutral,
- WSFG Trend: Neutral.
MSFG Month Jul
- Intermediate-Term
- MSFG Current: NA%
- F0%/NTZ' Bias: Price Neutral,
- MSFG Trend: Neutral.
YSFG Year 2026
- Long-Term
- YSFG Current: NA%
- F0%/NTZ' Bias: Price Neutral,
- YSFG Trend: Neutral.
Swing Pivots
- (Short-Term) 1. Pvt. Trend: DTrend,
- (Intermediate-Term) 2. HiLo Trend: UTrend,
- 3. Pvt. Evolve: Pvt Low 8608,
- 4. Pvt. Next: Pvt High 8806,
- 5. Levels R: 9233, 9084, 8976,
- 6. Levels S: 8608, 8496, 8297.
Daily Benchmarks
- (Short-Term) 5 Day: 8771 Down Trend,
- (Short-Term) 10 Day: 8770 Up Trend,
- (Intermediate-Term) 20 Day: 8803 Down Trend,
- (Intermediate-Term) 55 Day: 8761 Up Trend,
- (Long-Term) 100 Day: 8776 Down Trend,
- (Long-Term) 200 Day: 8804 Down Trend.
Additional Metrics
Overall Rating
- Short-Term: Bearish,
- Intermediate-Term: Neutral,
- Long-Term: Bearish.
Key Insights Summary
Daily structure is trading inside a broad two-way swing range with repeated pivots between the mid-8600s and upper-8800s, while the latest action sits near the 8780 area and the pivot trend remains down. The current price is clustering around the 5/10-day benchmarks and just below the 20-day/100-day zone, which keeps the tape mixed intraday but still capped by overhead resistance levels at 8806, 8976, 9084, and 9233. The hi/lo pivot sequence is still constructive at the intermediate layer, yet the dominant short-term swing read is still corrective after the prior lower-high/lower-low sequence. ATR is moderate and volume is steady, matching a market that is rotating rather than trending hard, with recent candles showing range compression and rejection near prior resistance. Overall, the chart reflects a choppy consolidation phase with bearish short-term tone, neutral-to-mixed intermediate structure, and a heavier long-term backdrop from the declining 100- and 200-day benchmarks.
Chart Analysis ATS AI Generated: 2026-07-10 07:07 for Informational use only, not trading advice. Terms and Risk Disclosure Copyright © 2026. Algo Trading Systems LLC.