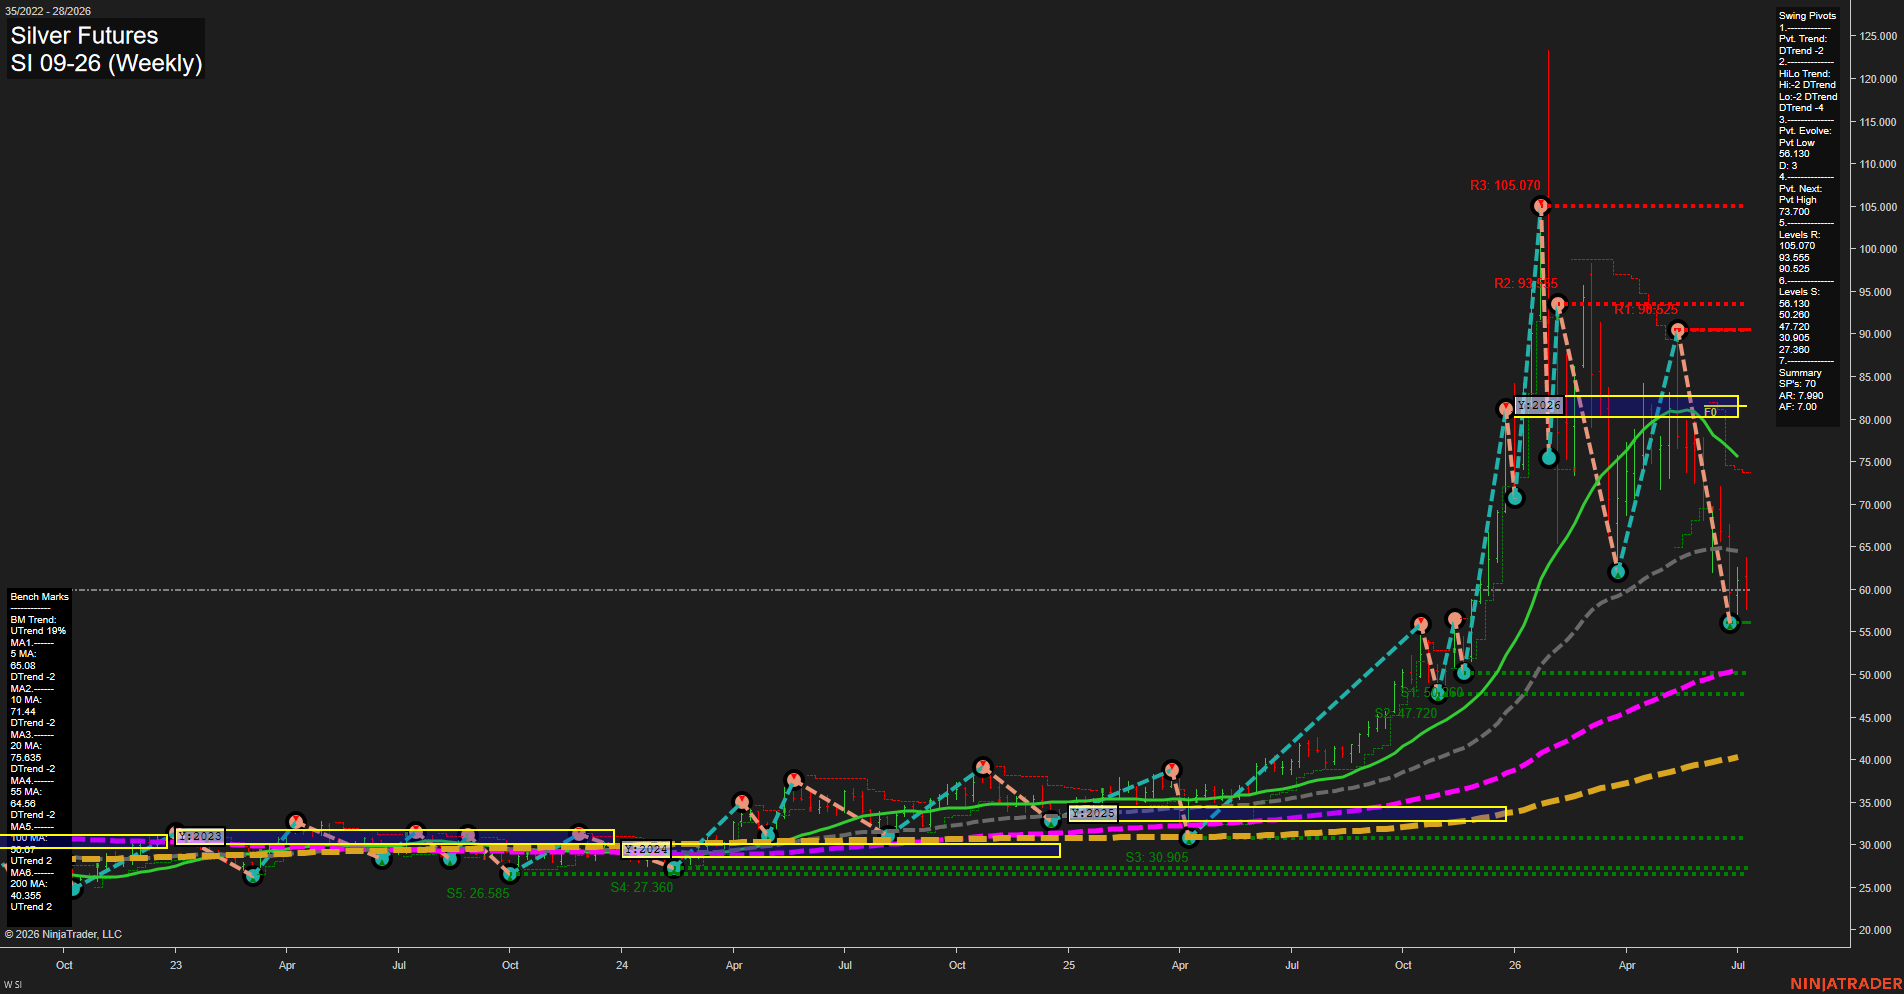
SI Silver Futures Weekly Chart Analysis: 2026-Jul-10 07:06 CT
Price Action
- Last: 56.130,
- Bars: Large,
- Mom: Fast.
WSFG Weekly
- Short-Term
- WSFG Current: -38%
- F0%/NTZ' Bias: Price Below,
- WSFG Trend: Down.
MSFG Month Jul
- Intermediate-Term
- MSFG Current: 8%
- F0%/NTZ' Bias: Price Above,
- MSFG Trend: Up.
YSFG Year 2026
- Long-Term
- YSFG Current: -175%
- F0%/NTZ' Bias: Price Below,
- YSFG Trend: Down.
Swing Pivots
- (Short-Term) 1. Pvt. Trend: DTrend,
- (Intermediate-Term) 2. HiLo Trend: DTrend,
- 3. Pvt. Evolve: Pvt Low 56.130,
- 4. Pvt. Next: Pvt High 73.700,
- 5. Levels R: 105.070, 93.555, 90.525,
- 6. Levels S: 56.130, 50.260, 47.720, 30.905, 27.360.
Weekly Benchmarks
- (Short-Term) 5 Day: 65.08 Down Trend,
- (Short-Term) 10 Day: 71.44 Down Trend,
- (Intermediate-Term) 20 Day: 75.635 Down Trend,
- (Intermediate-Term) 55 Day: 64.56 Down Trend,
- (Long-Term) 100 Day: 50.395 Up Trend,
- (Long-Term) 200 Day: 40.355 Up Trend.
Recent Trade Signals
- 10 Jul 2026: Long SI 09-26 @ 60.55 Signals.USAR-MSFG
- 09 Jul 2026: Long SI 09-26 @ 60.765 Signals.USAR.TR120
- 08 Jul 2026: Short SI 09-26 @ 61.085 Signals.USAR-WSFG
Overall Rating
- Short-Term: Bearish,
- Intermediate-Term: Bullish,
- Long-Term: Bearish.
Key Insights Summary
The weekly structure shows Silver in a sharp corrective selloff from the 90s down into the mid-50s, with the latest swing pivot confirming a DTrend and the current price sitting below the weekly fib grid center. Short-term momentum remains heavy, reinforced by the weak WSFG reading and the bearish clustering of the 5, 10, 20, and 55 day benchmarks, all pointing lower. In contrast, the month-level fib grid still holds an upward bias, and the recent long signals on MSFG and TR120 reflect a countertrend recovery attempt inside a broader retracement. Long-term context remains pressured by the yearly down grid and the failure to sustain price above prior swing resistance, even though the 100 and 200 day benchmarks still lean upward underneath the market. The bigger picture is a high-volatility reversal phase after a powerful rally, with lower highs now dominating the weekly swing map and the market testing whether the 50s area can stabilize after the break from the 70s and 90s zones.
Chart Analysis ATS AI Generated: 2026-07-10 07:07 for Informational use only, not trading advice. Terms and Risk Disclosure Copyright © 2026. Algo Trading Systems LLC.