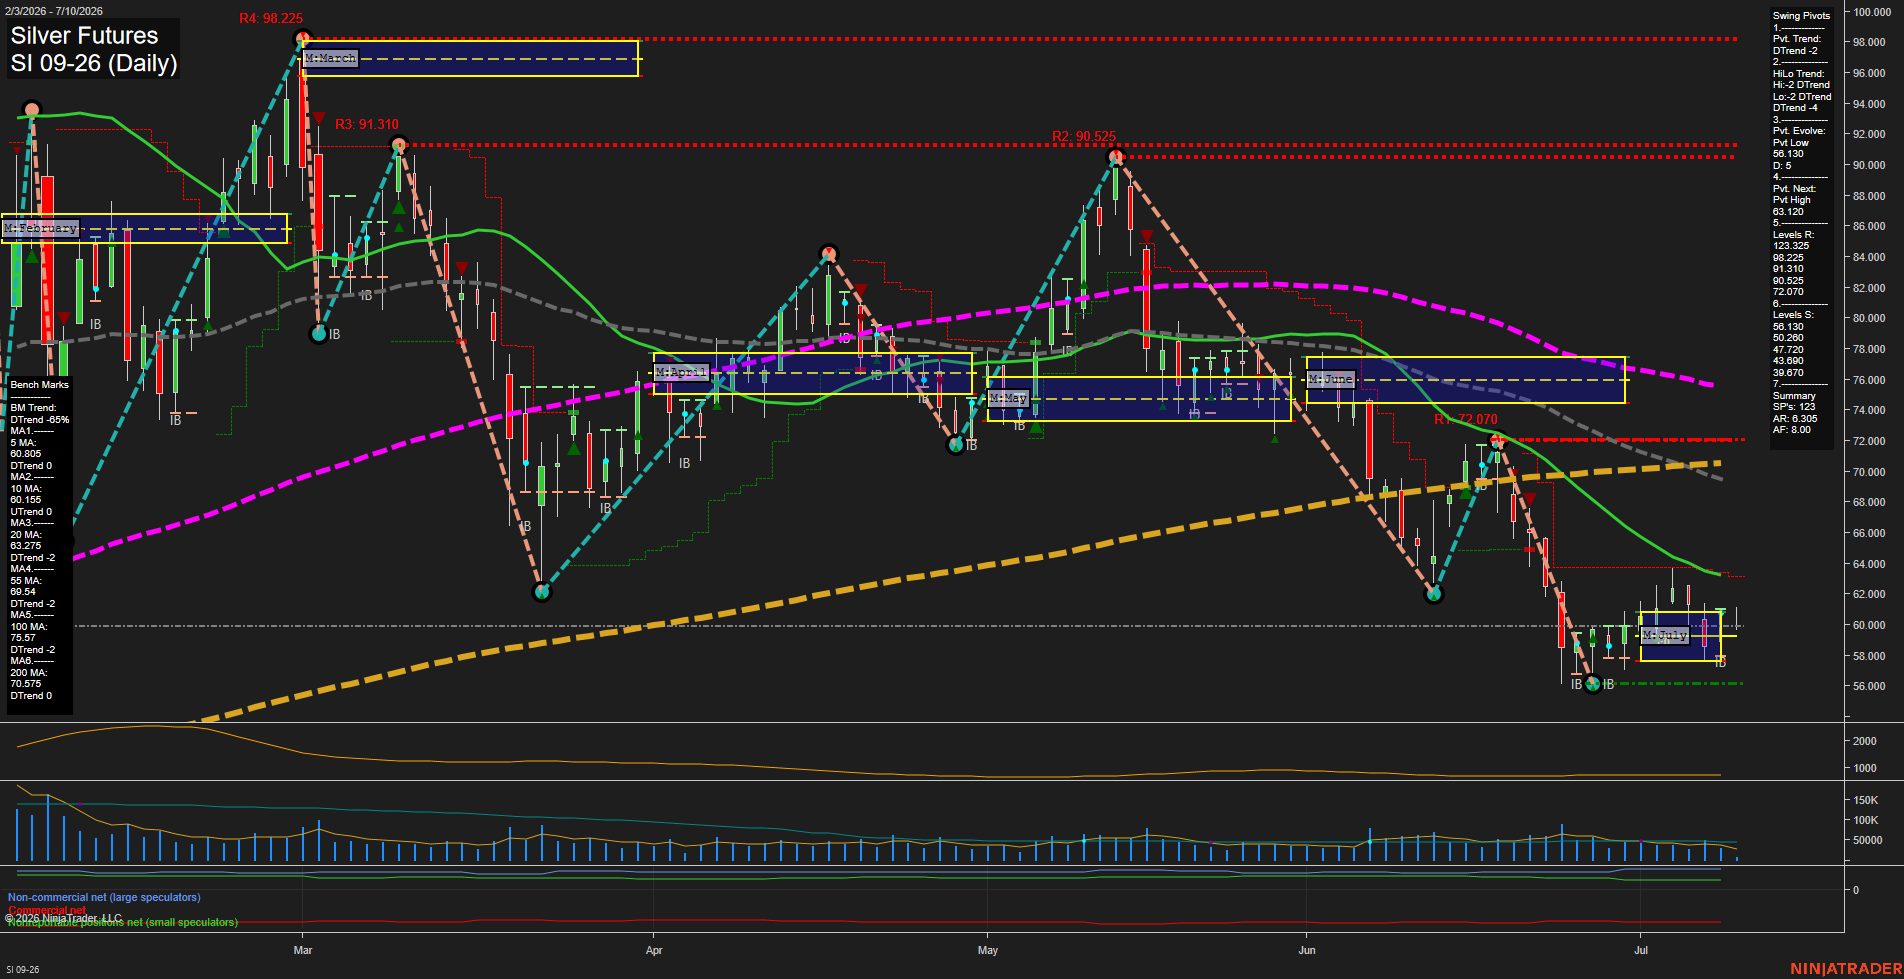
SI Silver Futures Daily Chart Analysis: 2026-Jul-10 07:06 CT
Price Action
- Last: 60.55,
- Bars: Medium,
- Mom: average.
WSFG Weekly
- Short-Term
- WSFG Current: -38%
- F0%/NTZ' Bias: Price Below,
- WSFG Trend: Down.
MSFG Month Jul
- Intermediate-Term
- MSFG Current: 8%
- F0%/NTZ' Bias: Price Above,
- MSFG Trend: Up.
YSFG Year 2026
- Long-Term
- YSFG Current: -175%
- F0%/NTZ' Bias: Price Below,
- YSFG Trend: Down.
Swing Pivots
- (Short-Term) 1. Pvt. Trend: DTrend,
- (Intermediate-Term) 2. HiLo Trend: DTrend,
- 3. Pvt. Evolve: Pvt Low 58.130,
- 4. Pvt. Next: Pvt High 63.120,
- 5. Levels R: 123.325, 98.225, 91.310, 90.525, 72.070,
- 6. Levels S: 58.130, 50.260, 47.220, 43.690, 39.680.
Daily Benchmarks
- (Short-Term) 5 Day: 60.805 Down Trend,
- (Short-Term) 10 Day: 60.155 Up Trend,
- (Intermediate-Term) 20 Day: 63.275 Down Trend,
- (Intermediate-Term) 55 Day: 69.540 Down Trend,
- (Long-Term) 100 Day: 75.570 Down Trend,
- (Long-Term) 200 Day: 70.575 Down Trend.
Additional Metrics
Recent Trade Signals
- 10 Jul 2026: Long SI 09-26 @ 60.55 Signals.USAR-MSFG
- 09 Jul 2026: Long SI 09-26 @ 60.765 Signals.USAR.TR120
- 08 Jul 2026: Short SI 09-26 @ 61.085 Signals.USAR-WSFG
Overall Rating
- Short-Term: Bearish,
- Intermediate-Term: Bearish,
- Long-Term: Bearish.
Key Insights Summary
Silver futures are trading near 60.55 after a sharp multi-month decline from the June pivot zone, with the chart still carrying a clearly lower-high, lower-low structure. Short-term price is below the weekly fib grid midpoint and sitting under the 5-day benchmark, while the pivot trend remains DTrend and the next meaningful pivot reference is the 63.120 high. The monthly fib grid is still positive on the current month at 8%, but price action remains below the broader intermediate moving average stack, keeping the month-to-month recovery in a contained rebound phase rather than a confirmed trend reversal. Long-term structure remains pressured with the 100-day and 200-day benchmarks both pointed down and the yearly fib grid still negative, which keeps the dominant bias aligned with the larger downtrend even as the market attempts to stabilize near the July consolidation box.
Chart Analysis ATS AI Generated: 2026-07-10 07:06 for Informational use only, not trading advice. Terms and Risk Disclosure Copyright © 2026. Algo Trading Systems LLC.