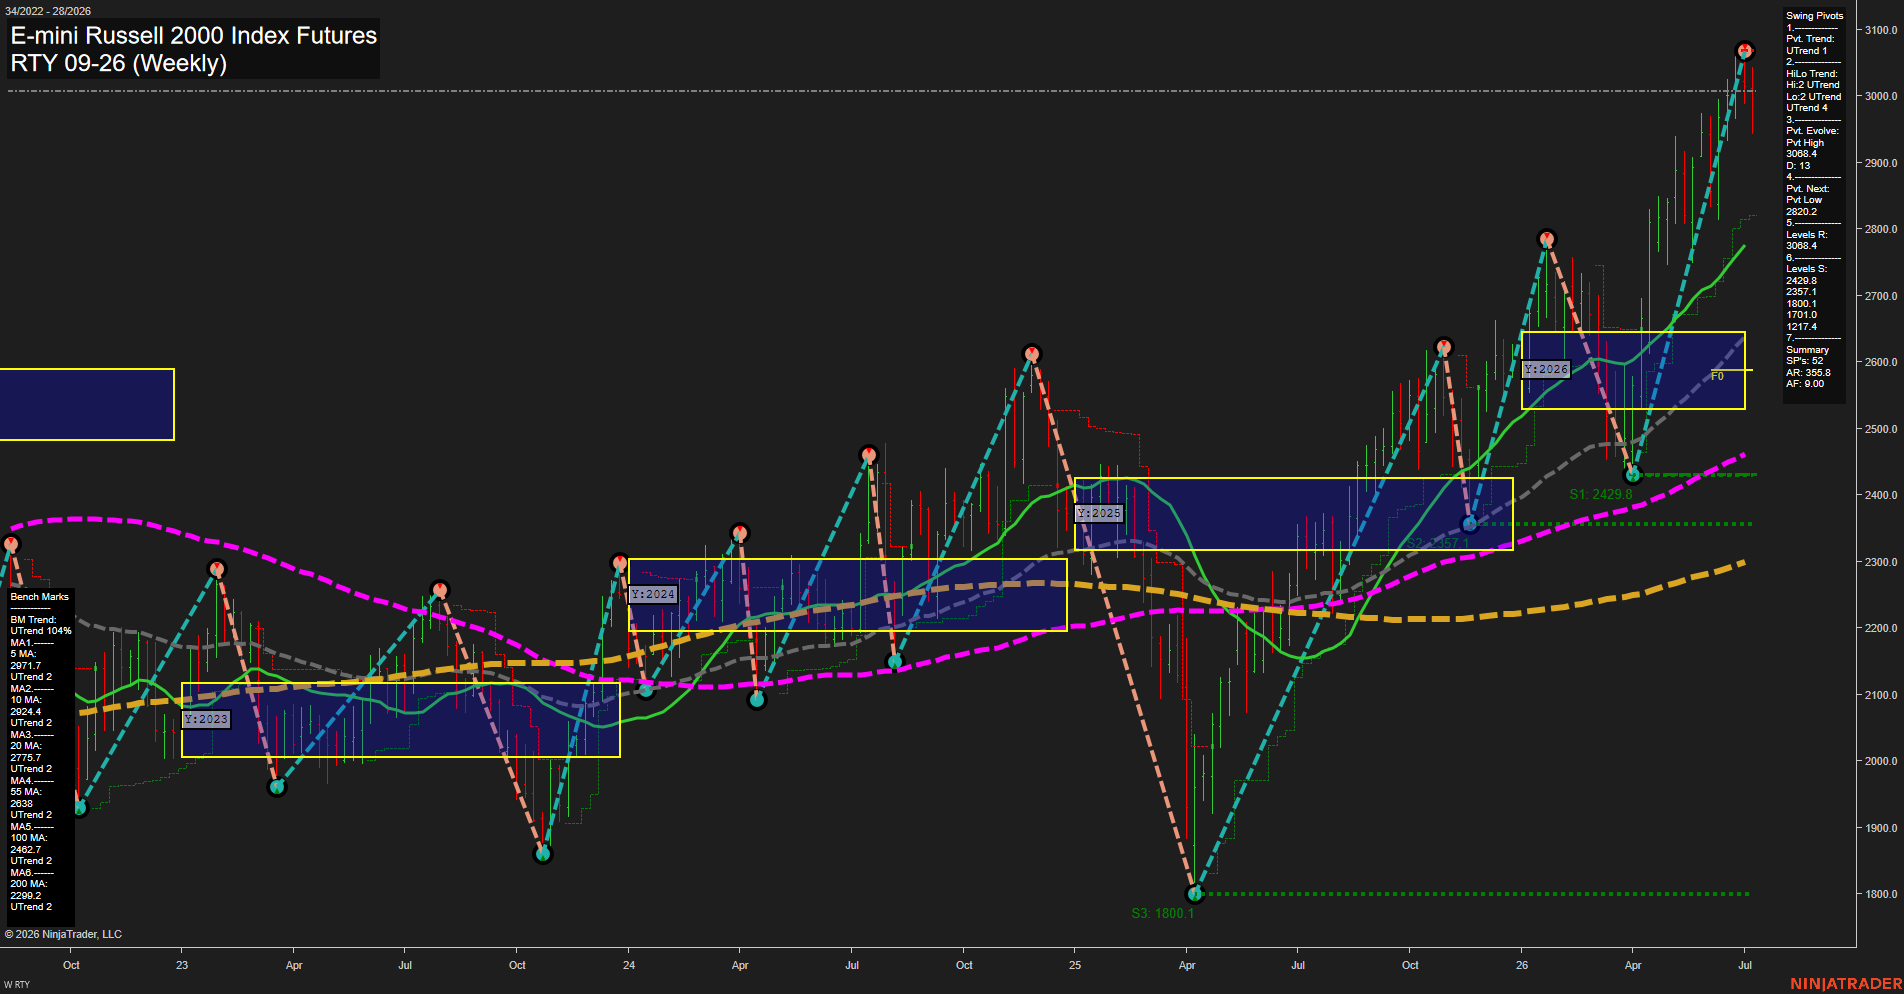
RTY E-mini Russell 2000 Index Futures Weekly Chart Analysis: 2026-Jul-10 07:06 CT
Price Action
- Last: 3068.4,
- Bars: Large,
- Mom: fast.
WSFG Weekly
- Short-Term
- WSFG Current: -12%
- F0%/NTZ' Bias: Price Below,
- WSFG Trend: Down.
MSFG Month Jul
- Intermediate-Term
- MSFG Current: -11%
- F0%/NTZ' Bias: Price Below,
- MSFG Trend: Down.
YSFG Year 2026
- Long-Term
- YSFG Current: 73%
- F0%/NTZ' Bias: Price Above,
- YSFG Trend: Up.
Swing Pivots
- (Short-Term) 1. Pvt. Trend: UTrend,
- (Intermediate-Term) 2. HiLo Trend: UTrend,
- 3. Pvt. Evolve: Pvt High 3068.4,
- 4. Pvt. Next: Pvt Low 2820.2,
- 5. Levels R: 3068.4,
- 6. Levels S: 2429.8, 2357.1, 1800.1, 1701.0, 1217.4.
Weekly Benchmarks
- (Short-Term) 5 Day: 2971.7 Up Trend,
- (Short-Term) 10 Day: 2924.4 Up Trend,
- (Intermediate-Term) 20 Day: 2775.7 Up Trend,
- (Intermediate-Term) 55 Day: 2638.0 Up Trend,
- (Long-Term) 100 Day: 2462.7 Up Trend,
- (Long-Term) 200 Day: 2289.2 Up Trend.
Recent Trade Signals
- 09 Jul 2026: Long RTY 09-26 @ 3005 Signals.USAR.TR120
- 09 Jul 2026: Short RTY 09-26 @ 2983.1 Signals.USAR-MSFG
- 07 Jul 2026: Short RTY 09-26 @ 3007.4 Signals.USAR-WSFG
Overall Rating
- Short-Term: Bullish,
- Intermediate-Term: Bullish,
- Long-Term: Bullish.
Key Insights Summary
RTY is pressing into fresh highs with strong weekly momentum and a large-bar expansion phase, which keeps the tape in a decisive bullish swing condition. The yearly fib grid remains firmly above its midpoint with price holding in the upper NTZ, while the weekly and monthly session fib grids still show negative current values and below-F0% bias, reflecting that the recent surge has been advancing out of prior imbalance rather than from a stable midrange. Swing structure is aligned higher, with the pivot trend and HiLo trend both in UTrend and the current evolving pivot marked by a high at 3068.4. All benchmark moving averages are stacked in bullish order and rising, confirming trend alignment across short, intermediate, and long horizons. The recent signal mix shows both countertrend short entries and a fresh long trigger, highlighting a breakout regime with elevated two-way response around the new highs and prior pivot zones.
Chart Analysis ATS AI Generated: 2026-07-10 07:06 for Informational use only, not trading advice. Terms and Risk Disclosure Copyright © 2026. Algo Trading Systems LLC.