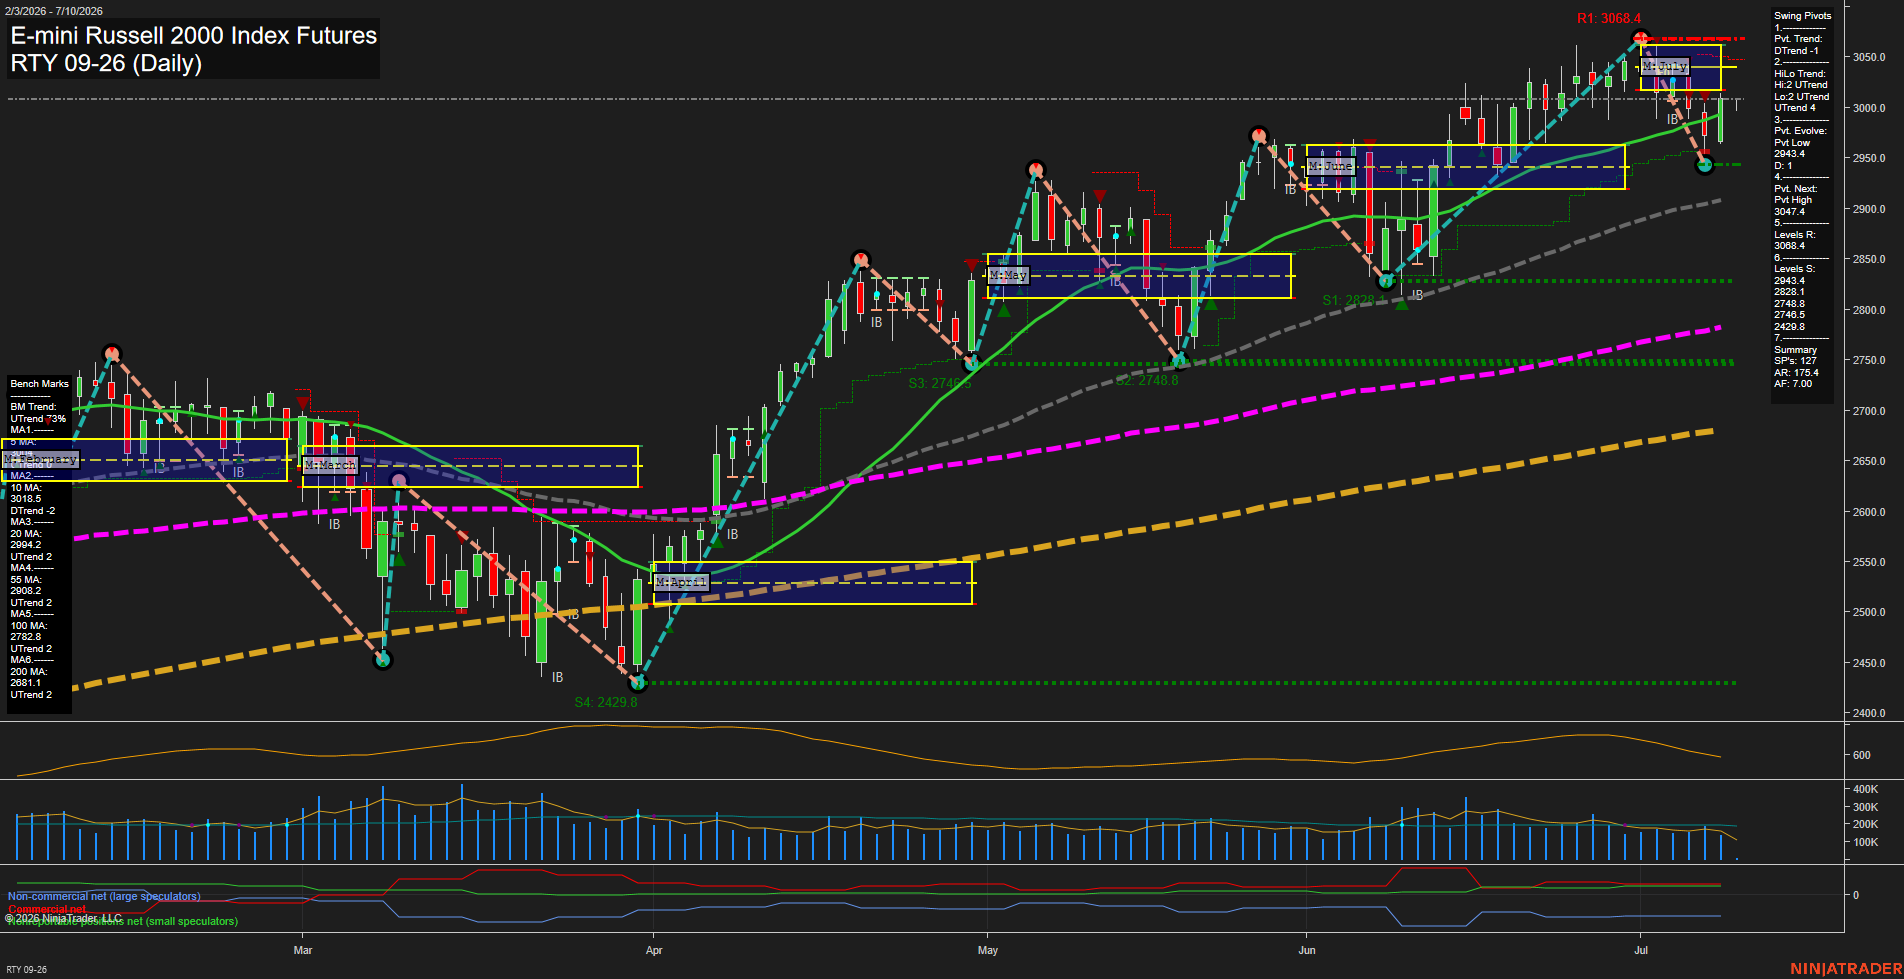
RTY E-mini Russell 2000 Index Futures Daily Chart Analysis: 2026-Jul-10 07:06 CT
Price Action
- Last: 3001.0,
- Bars: Large,
- Mom: fast.
WSFG Weekly
- Short-Term
- WSFG Current: -12%
- F0%/NTZ' Bias: Price Below,
- WSFG Trend: Down.
MSFG Month Jul
- Intermediate-Term
- MSFG Current: -11%
- F0%/NTZ' Bias: Price Below,
- MSFG Trend: Down.
YSFG Year 2026
- Long-Term
- YSFG Current: 73%
- F0%/NTZ' Bias: Price Above,
- YSFG Trend: Up.
Swing Pivots
- (Short-Term) 1. Pvt. Trend: DTrend,
- (Intermediate-Term) 2. HiLo Trend: UTrend,
- 3. Pvt. Evolve: Pvt Low 2943.4,
- 4. Pvt. Next: Pvt High 3047.4,
- 5. Levels R: 3068.4,
- 6. Levels S: 2943.4 2828.1 2748.8 2746.5 2429.8.
Daily Benchmarks
- (Short-Term) 5 Day: 3025.0 Down Trend,
- (Short-Term) 10 Day: 3018.5 Down Trend,
- (Intermediate-Term) 20 Day: 2994.2 Up Trend,
- (Intermediate-Term) 55 Day: 2908.2 Up Trend,
- (Long-Term) 100 Day: 2782.8 Up Trend,
- (Long-Term) 200 Day: 2681.1 Up Trend.
Additional Metrics
Recent Trade Signals
- 09 Jul 2026: Long RTY 09-26 @ 3005 Signals.USAR.TR120
- 09 Jul 2026: Short RTY 09-26 @ 2983.1 Signals.USAR-MSFG
- 07 Jul 2026: Short RTY 09-26 @ 3007.4 Signals.USAR-WSFG
Overall Rating
- Short-Term: Bearish,
- Intermediate-Term: Neutral,
- Long-Term: Bullish.
Key Insights Summary
RTY is trading with a short-term rejection structure after an extended rally into the upper pivot band near the 3047.4 to 3068.4 resistance zone. The daily swing pivot has turned DTrend while the HiLo structure remains UTrend, showing a mixed but still constructive intermediate backdrop. Price is below both the weekly and July session fib grids, which keeps the near-term tone soft, while the yearly grid remains well above its midpoint and supports the broader long-term uptrend. The benchmark stack is mixed at the top end, with price under the 5 and 10 day averages but still above the 20, 55, 100, and 200 day averages, reflecting a pullback inside a larger bullish trend. Recent signals show a sequence of short and long triggers around the 3000 area, consistent with a choppy transition phase after the June-to-July advance.
Chart Analysis ATS AI Generated: 2026-07-10 07:06 for Informational use only, not trading advice. Terms and Risk Disclosure Copyright © 2026. Algo Trading Systems LLC.