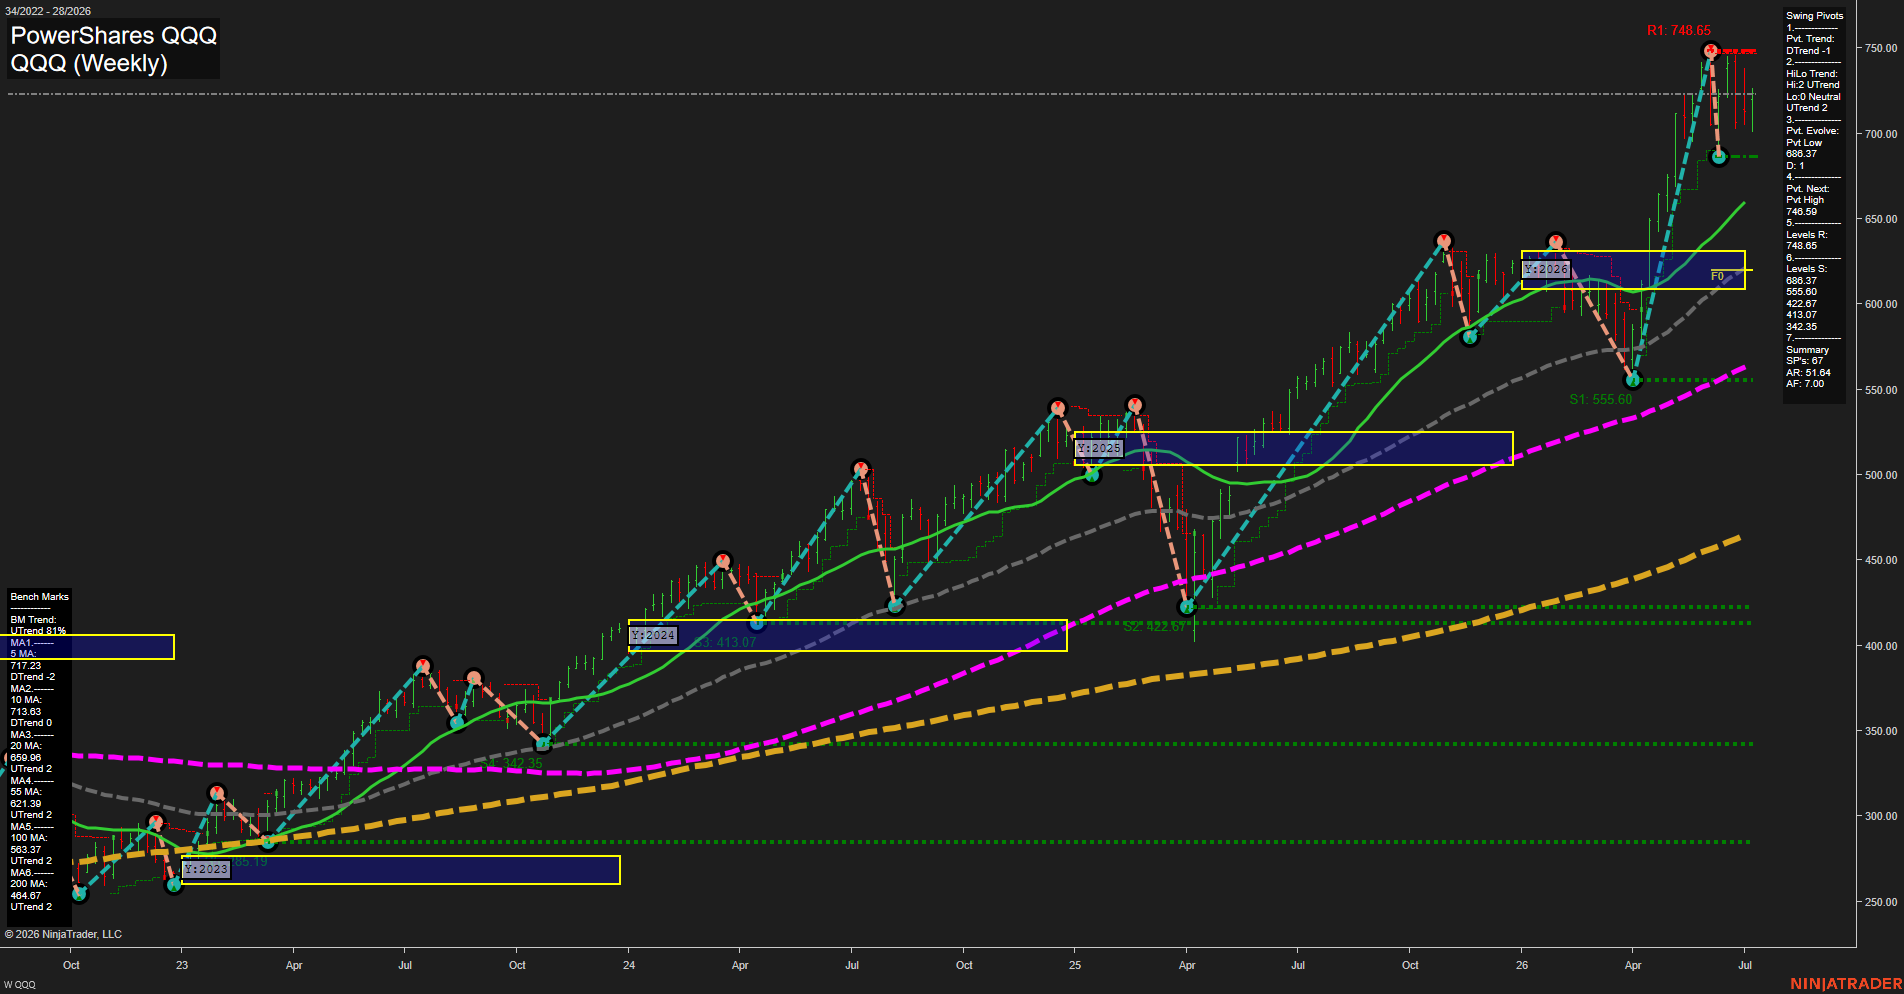
QQQ PowerShares QQQ Weekly Chart Analysis: 2026-Jul-10 07:05 CT
Price Action
- Last: 717.23,
- Bars: Large,
- Mom: fast.
WSFG Weekly
- Short-Term
- WSFG Current: NA%
- F0%/NTZ' Bias: Price Neutral,
- WSFG Trend: Neutral.
MSFG Month Jul
- Intermediate-Term
- MSFG Current: NA%
- F0%/NTZ' Bias: Price Neutral,
- MSFG Trend: Neutral.
YSFG Year 2026
- Long-Term
- YSFG Current: NA%
- F0%/NTZ' Bias: Price Neutral,
- YSFG Trend: Neutral.
Swing Pivots
- (Short-Term) 1. Pvt. Trend: DTrend,
- (Intermediate-Term) 2. HiLo Trend: UTrend,
- 3. Pvt. Evolve: Pvt Low 688.37,
- 4. Pvt. Next: Pvt High 748.59,
- 5. Levels R: 748.65,
- 6. Levels S: 688.37, 555.60, 422.67, 413.07, 342.35.
Weekly Benchmarks
- (Short-Term) 5 Day: 717.23 Down Trend,
- (Short-Term) 10 Day: 713.63 Down Trend,
- (Intermediate-Term) 20 Day: 659.96 Up Trend,
- (Intermediate-Term) 55 Day: 621.39 Up Trend,
- (Long-Term) 100 Day: 583.37 Up Trend,
- (Long-Term) 200 Day: 464.67 Up Trend.
Overall Rating
- Short-Term: Bullish,
- Intermediate-Term: Bullish,
- Long-Term: Bullish.
Key Insights Summary
QQQ is in a strong weekly uptrend with a large recent bar structure and fast momentum, showing an extended advance that has repeatedly respected higher swing lows and higher swing highs. Price is holding well above the 20, 55, 100, and 200 week benchmarks, which keeps the intermediate and long-term structure firmly constructive. The short-term picture is more rotational, with the latest swing pivot evolving from a low and the next pivot defined at the prior high near 748.59, placing price in a push toward the upper pivot resistance zone. The weekly profile remains broad and trend-positive, with prior consolidation zones acting as platforms for continuation rather than reversal.
Chart Analysis ATS AI Generated: 2026-07-10 07:06 for Informational use only, not trading advice. Terms and Risk Disclosure Copyright © 2026. Algo Trading Systems LLC.