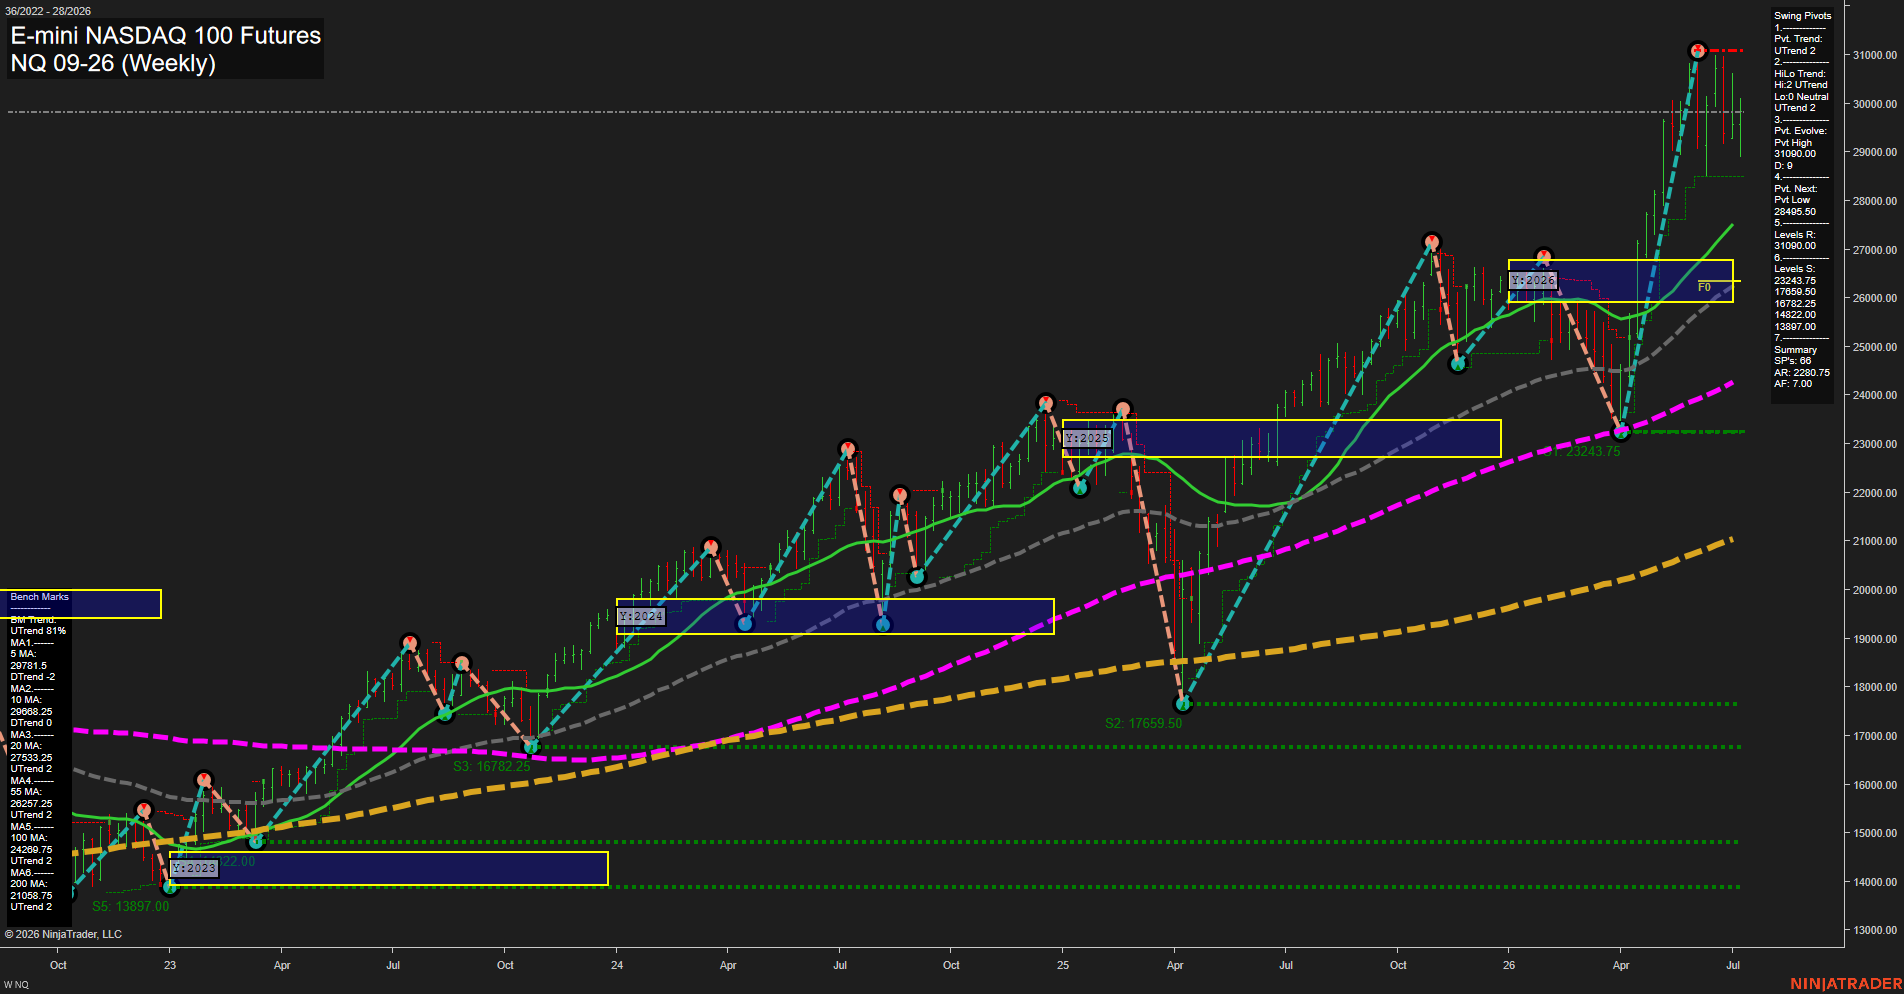
NQ E-mini NASDAQ 100 Futures Weekly Chart Analysis: 2026-Jul-10 07:05 CT
Price Action
- Last: 29849.50,
- Bars: Large,
- Mom: fast.
WSFG Weekly
- Short-Term
- WSFG Current: -8%
- F0%/NTZ' Bias: Price Below,
- WSFG Trend: Down.
MSFG Month Jul
- Intermediate-Term
- MSFG Current: -22%
- F0%/NTZ' Bias: Price Below,
- MSFG Trend: Down.
YSFG Year 2026
- Long-Term
- YSFG Current: 79%
- F0%/NTZ' Bias: Price Above,
- YSFG Trend: Up.
Swing Pivots
- (Short-Term) 1. Pvt. Trend: UTrend,
- (Intermediate-Term) 2. HiLo Trend: UTrend,
- 3. Pvt. Evolve: Pvt High 31090.00,
- 4. Pvt. Next: Pvt Low 28495.50,
- 5. Levels R: 31090.00,
- 6. Levels S: 28495.50, 26243.75, 17659.50, 16782.25, 13897.00.
Weekly Benchmarks
- (Short-Term) 5 Day: 29781.50 Down Trend,
- (Short-Term) 10 Day: 29668.25 Down Trend,
- (Intermediate-Term) 20 Day: 27533.25 Up Trend,
- (Intermediate-Term) 55 Day: 28257.25 Up Trend,
- (Long-Term) 100 Day: 24269.75 Up Trend,
- (Long-Term) 200 Day: 21058.75 Up Trend.
Recent Trade Signals
- 09 Jul 2026: Long NQ 09-26 @ 29684.75 Signals.USAR.TR120
- 07 Jul 2026: Short NQ 09-26 @ 29626.25 Signals.USAR-WSFG
- 06 Jul 2026: Short NQ 09-26 @ 29879 Signals.USAR-MSFG
Overall Rating
- Short-Term: Neutral,
- Intermediate-Term: Bearish,
- Long-Term: Bullish.
Key Insights Summary
Weekly price remains in a powerful long-term uptrend, but the current tape is digesting a sharp selloff from the 31,090 swing high back toward the upper-29,000s. The short-term session grid is below F0% and still reads down, while July’s monthly grid also remains below its center and retains a bearish bias. That contrasts with the yearly grid, which stays firmly above F0% and supports the broader bullish structure. Swing pivots still show an upward pivot framework, with the latest large expansion move producing a fast rally off the 28,495.50 reaction low and then a test near the 31,090 resistance zone. Benchmark alignment is constructive above the 20, 55, 100, and 200-day averages, but the 5 and 10-day measures remain below price and reflect the current pullback phase. The signal sequence shows a short-term mix of long and short triggers, with the more recent shorts tied to the weaker weekly and monthly grids and the latest long reflecting the rebound off lower support. Overall, the chart is in a volatile higher-timeframe uptrend with a recent corrective swing and a developing test of whether the post-rally pullback is a consolidation pause or a deeper retracement.
Chart Analysis ATS AI Generated: 2026-07-10 07:05 for Informational use only, not trading advice. Terms and Risk Disclosure Copyright © 2026. Algo Trading Systems LLC.