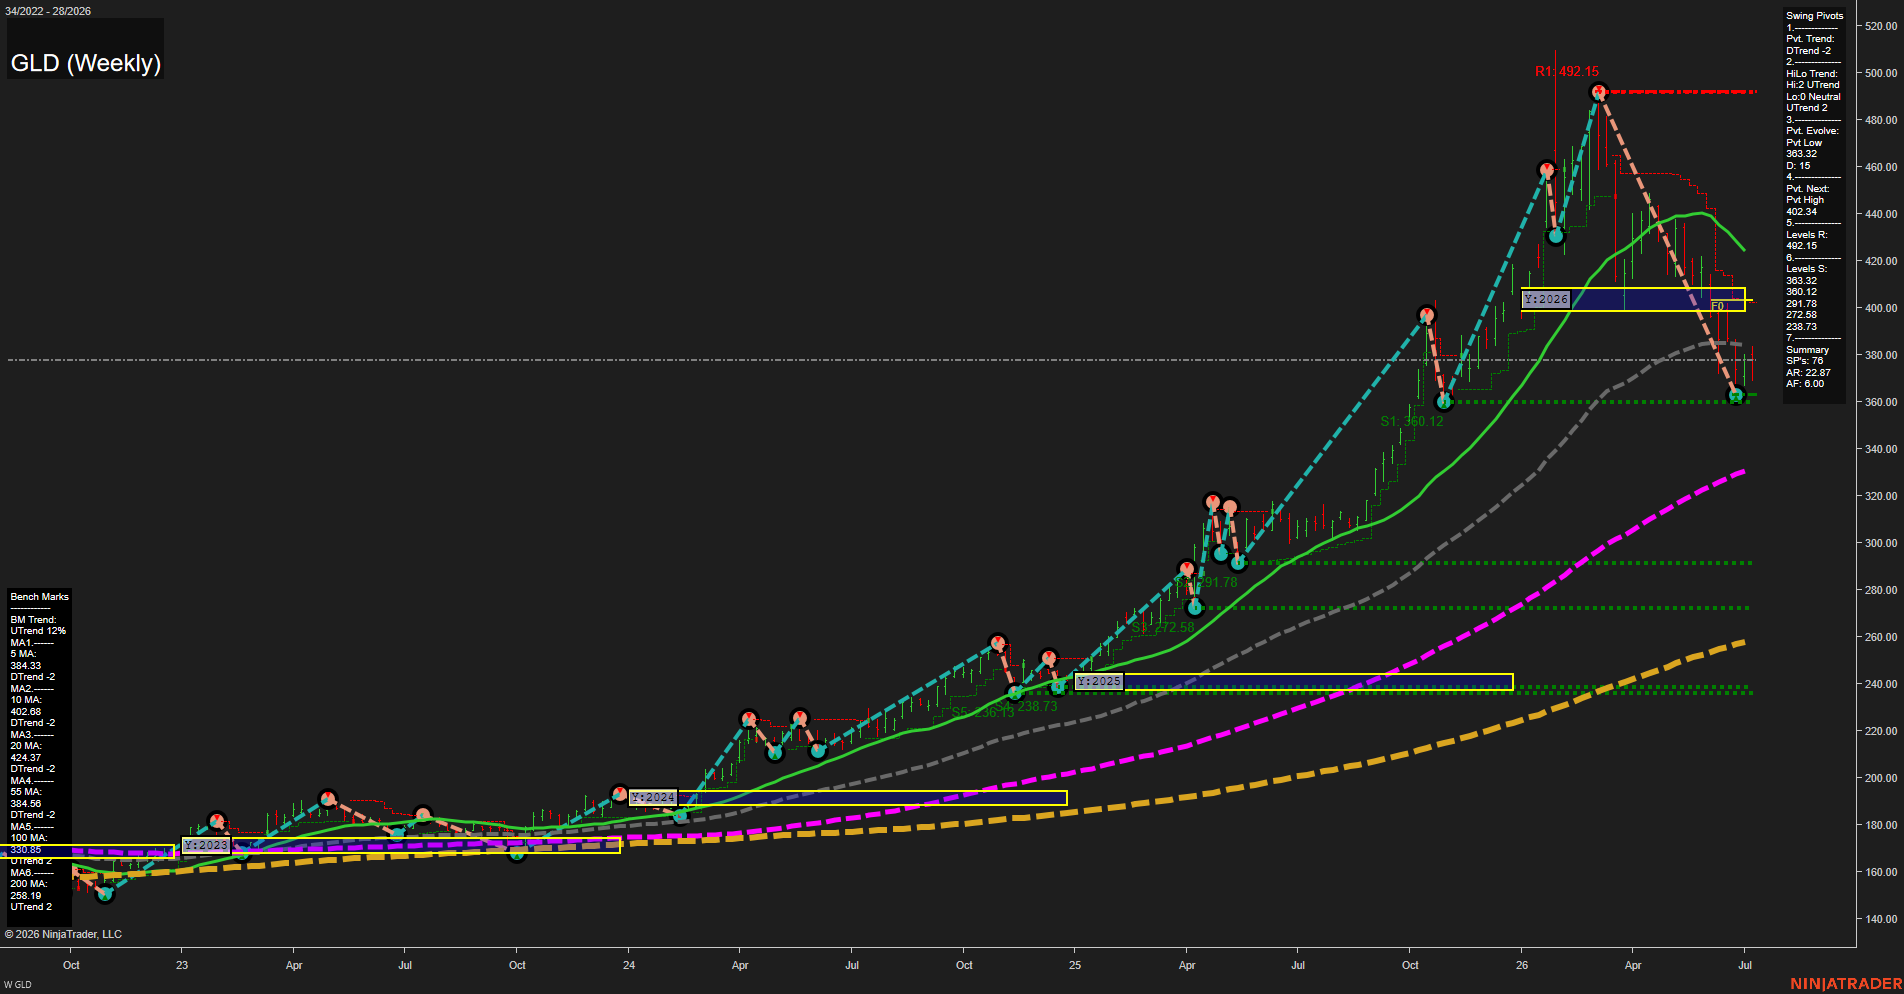
GLD SPDR Gold Shares Weekly Chart Analysis: 2026-Jul-10 07:04 CT
Price Action
- Last: 360.12,
- Bars: Large,
- Mom: fast.
WSFG Weekly
- Short-Term
- WSFG Current: NA%
- F0%/NTZ' Bias: Price Neutral,
- WSFG Trend: Neutral.
MSFG Month Jul
- Intermediate-Term
- MSFG Current: NA%
- F0%/NTZ' Bias: Price Neutral,
- MSFG Trend: Neutral.
YSFG Year 2026
- Long-Term
- YSFG Current: NA%
- F0%/NTZ' Bias: Price Neutral,
- YSFG Trend: Neutral.
Swing Pivots
- (Short-Term) 1. Pvt. Trend: DTrend,
- (Intermediate-Term) 2. HiLo Trend: UTrend,
- 3. Pvt. Evolve: Pvt Low 363.32,
- 4. Pvt. Next: Pvt High 402.34,
- 5. Levels R: 492.15,
- 6. Levels S: 383.32, 380.12, 291.78, 272.58, 238.73.
Weekly Benchmarks
- (Short-Term) 5 Day: 384.33 Down Trend,
- (Short-Term) 10 Day: 402.68 Down Trend,
- (Intermediate-Term) 20 Day: 424.37 Down Trend,
- (Intermediate-Term) 55 Day: 384.56 Down Trend,
- (Long-Term) 100 Day: 330.85 Up Trend,
- (Long-Term) 200 Day: 258.19 Up Trend.
Overall Rating
- Short-Term: Bearish,
- Intermediate-Term: Bearish,
- Long-Term: Bullish.
Key Insights Summary
GLD’s weekly structure is in a sharp corrective phase after a major impulse to the 490s, with price now back near the 360 area and pressing below the short- and intermediate-term benchmark averages. The swing pivot model shows the short-term pivot trend turned down while the broader hi/lo structure remains constructive, reflecting a larger uptrend that has entered a deep retracement. The 2026 yearly fib zone sits above the current market, so price is trading below the NTZ band and below the prior pivot support stack, reinforcing a weak near-term tape. Long-term moving averages remain positively sloped, keeping the broader trend framework bullish despite the recent selloff.
Chart Analysis ATS AI Generated: 2026-07-10 07:04 for Informational use only, not trading advice. Terms and Risk Disclosure Copyright © 2026. Algo Trading Systems LLC.