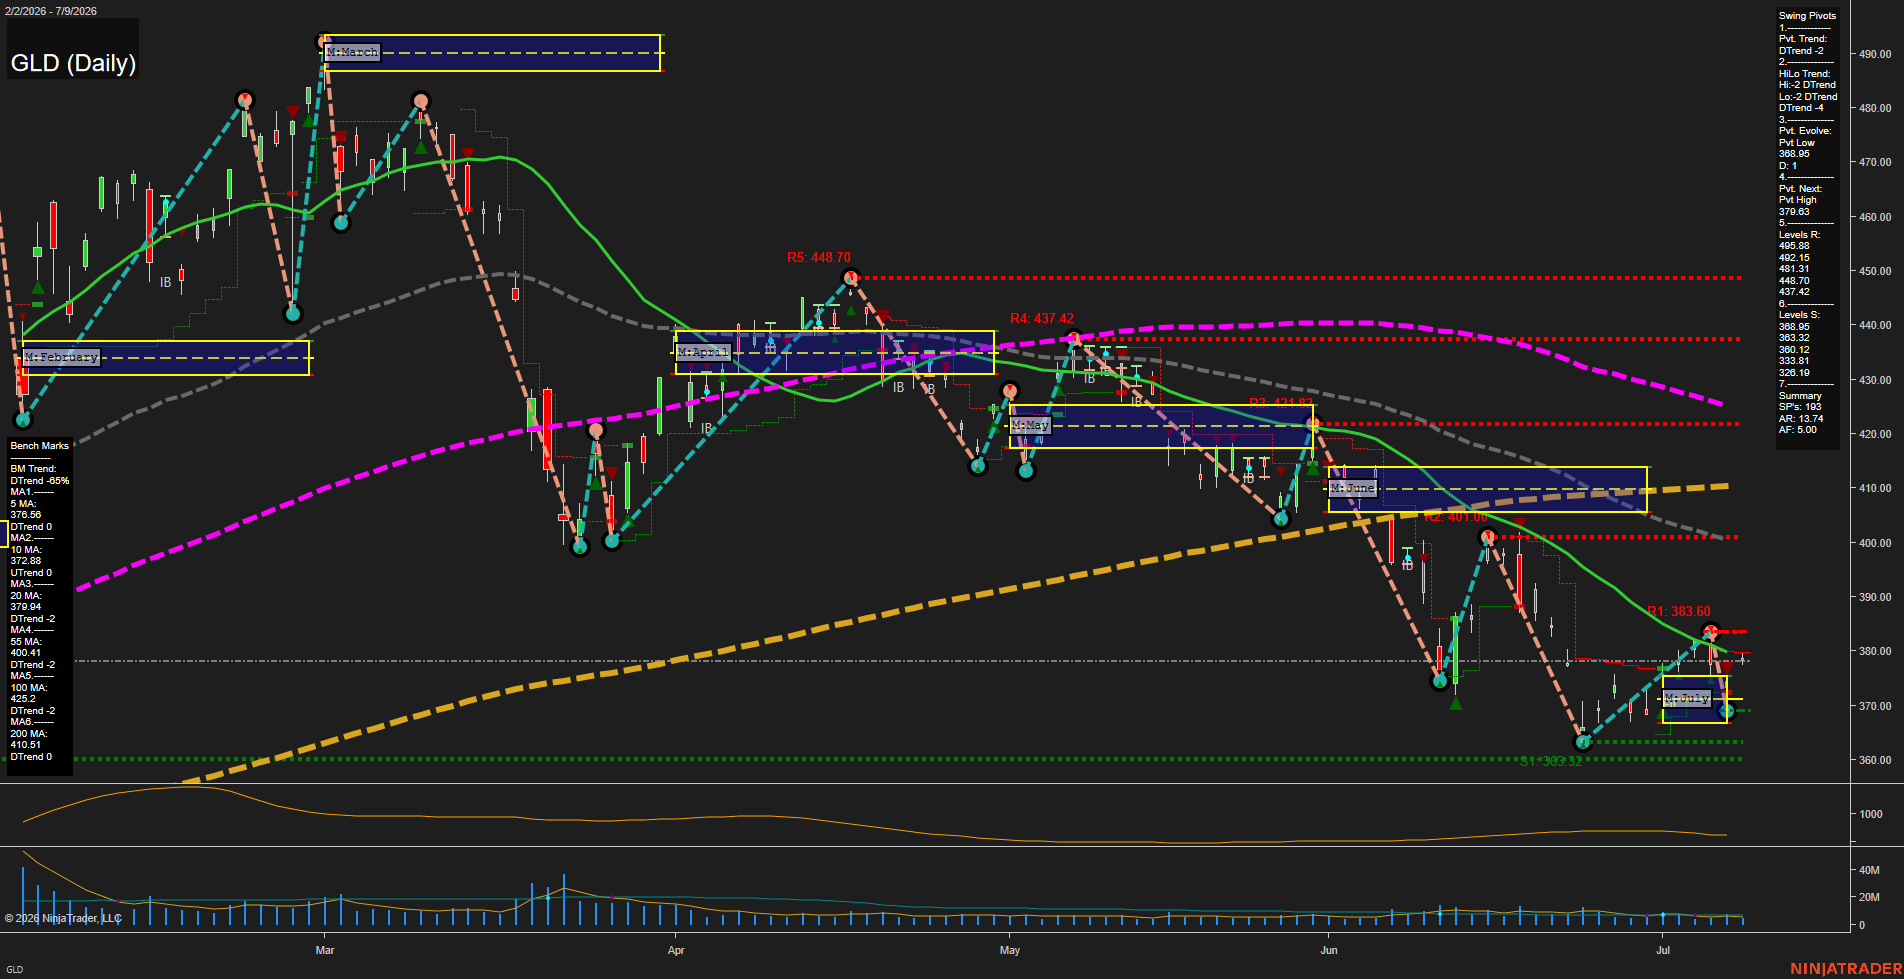
GLD SPDR Gold Shares Daily Chart Analysis: 2026-Jul-10 07:04 CT
Price Action
- Last: 378.0,
- Bars: Medium,
- Mom: slow.
WSFG Weekly
- Short-Term
- WSFG Current: NA%
- F0%/NTZ' Bias: Price Neutral,
- WSFG Trend: Neutral.
MSFG Month Jul
- Intermediate-Term
- MSFG Current: NA%
- F0%/NTZ' Bias: Price Neutral,
- MSFG Trend: Neutral.
YSFG Year 2026
- Long-Term
- YSFG Current: NA%
- F0%/NTZ' Bias: Price Neutral,
- YSFG Trend: Neutral.
Swing Pivots
- (Short-Term) 1. Pvt. Trend: DTrend,
- (Intermediate-Term) 2. HiLo Trend: DTrend,
- 3. Pvt. Evolve: Pvt low 368.95,
- 4. Pvt. Next: Pvt high 379.63,
- 5. Levels R: 495.88, 492.15, 481.31, 448.70, 437.42, 383.60, 382.15, 401.10,
- 6. Levels S: 363.32, 368.95, 383.32, 360.12, 338.81, 326.19.
Daily Benchmarks
- (Short-Term) 5 Day: 376.58 Down Trend,
- (Short-Term) 10 Day: 372.88 Up Trend,
- (Intermediate-Term) 20 Day: 379.94 Down Trend,
- (Intermediate-Term) 55 Day: 400.41 Down Trend,
- (Long-Term) 100 Day: 425.2 Down Trend,
- (Long-Term) 200 Day: 410.51 Down Trend.
Additional Metrics
Overall Rating
- Short-Term: Bearish,
- Intermediate-Term: Bearish,
- Long-Term: Bearish.
Key Insights Summary
GLD is trading in a broader bearish swing structure with the daily pivot trend and HiLo trend both still pointing down, while price remains below the 20-, 55-, 100-, and 200-day benchmark averages. The recent action shows a countertrend rebound from the mid-360s into the high-370s, but the larger pattern remains a sequence of lower highs and lower lows against declining intermediate and long-term benchmarks. The monthly and yearly session fib grids are neutral in the template view, so the dominant read comes from the pivot map and moving-average stack, which keeps the tone weak-to-bearish even as price stabilizes near the July session zone.
Chart Analysis ATS AI Generated: 2026-07-10 07:04 for Informational use only, not trading advice. Terms and Risk Disclosure Copyright © 2026. Algo Trading Systems LLC.