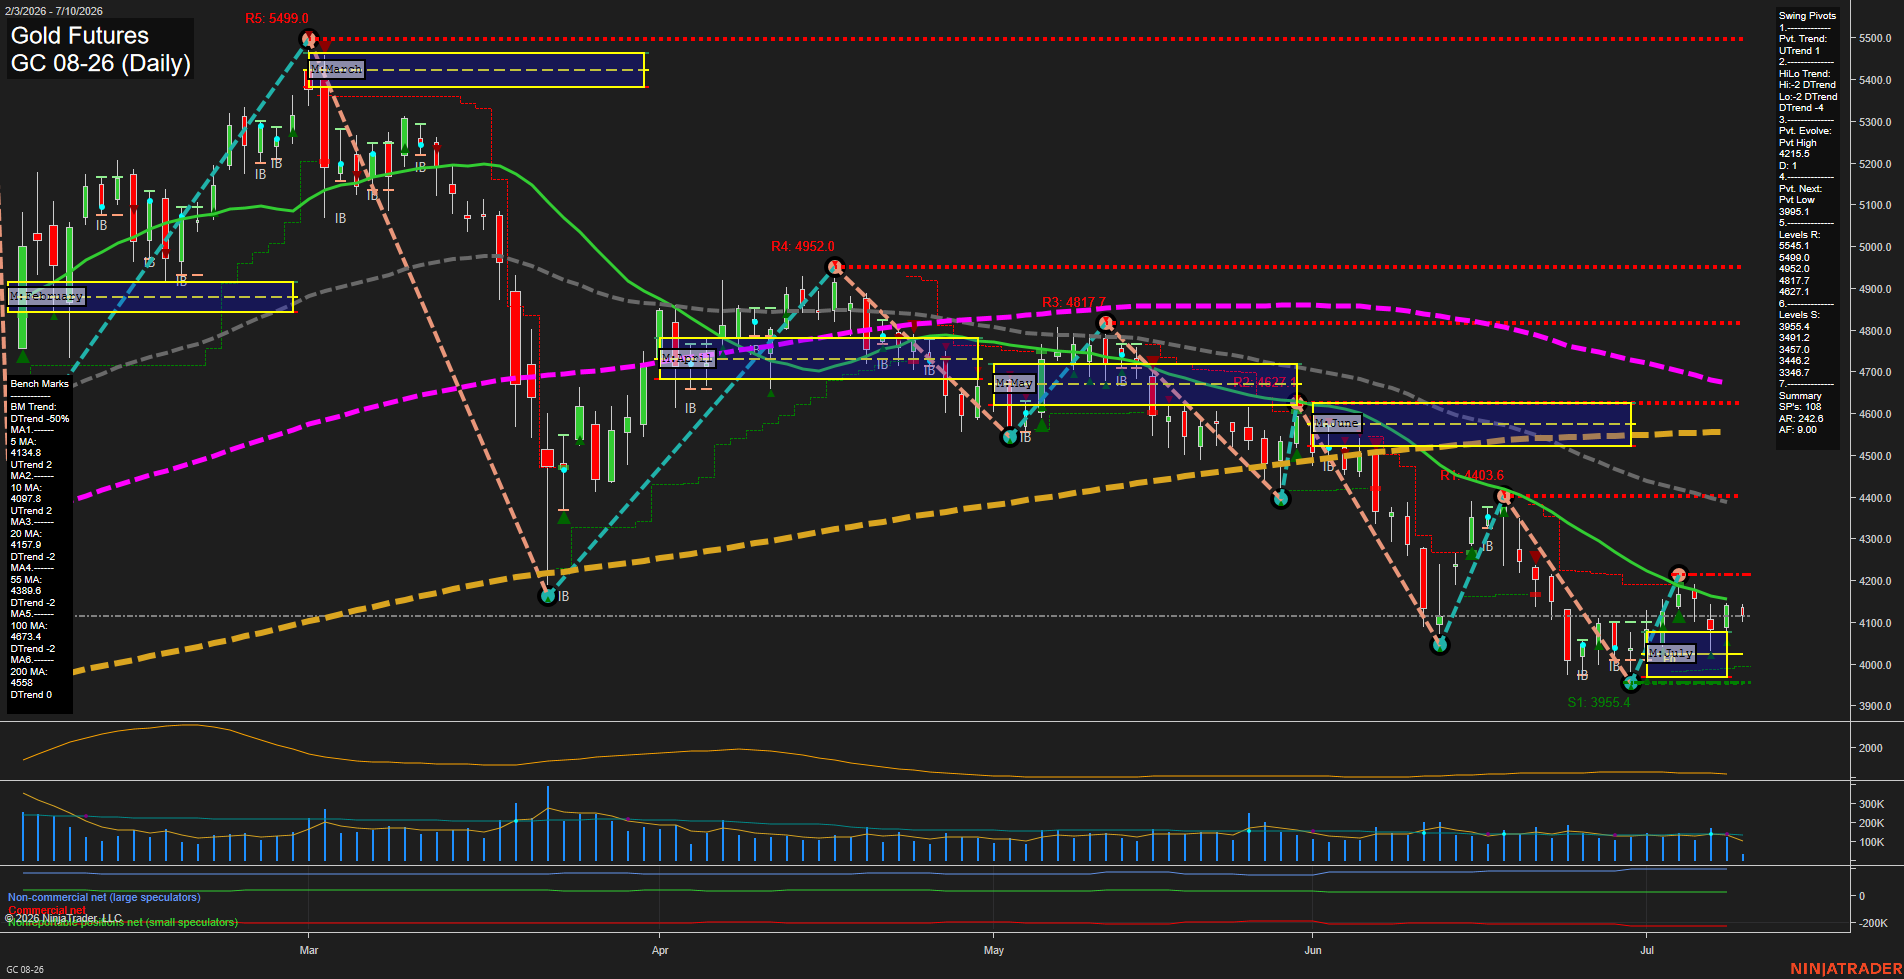
GC Gold Futures Daily Chart Analysis: 2026-Jul-10 07:04 CT
Price Action
- Last: 4128.8,
- Bars: Small,
- Mom: Slow.
WSFG Weekly
- Short-Term
- WSFG Current: -31%
- F0%/NTZ' Bias: Price Below,
- WSFG Trend: Down.
MSFG Month Jul
- Intermediate-Term
- MSFG Current: 19%
- F0%/NTZ' Bias: Price Above,
- MSFG Trend: Up.
YSFG Year 2026
- Long-Term
- YSFG Current: -108%
- F0%/NTZ' Bias: Price Below,
- YSFG Trend: Down.
Swing Pivots
- (Short-Term) 1. Pvt. Trend: DTrend,
- (Intermediate-Term) 2. HiLo Trend: DTrend,
- 3. Pvt. Evolve: Pvt High 4215.5,
- 4. Pvt. Next: Pvt Low 3995.1,
- 5. Levels R: 5545.1, 5499.0, 4952.0, 4817.7, 4627.1,
- 6. Levels S: 3955.4, 3491.2, 3457.0, 3446.2, 3376.3.
Daily Benchmarks
- (Short-Term) 5 Day: 4134.8 Down Trend,
- (Short-Term) 10 Day: 4097.8 Down Trend,
- (Intermediate-Term) 20 Day: 4157.9 Down Trend,
- (Intermediate-Term) 55 Day: 4389.6 Down Trend,
- (Long-Term) 100 Day: 4673.4 Down Trend,
- (Long-Term) 200 Day: 4558.0 Down Trend.
Additional Metrics
- ATR: 242.6,
- VOLMA: 182966.
Recent Trade Signals
- 10 Jul 2026: Long GC 08-26 @ 4128.8 Signals.USAR-MSFG
- 08 Jul 2026: Short GC 08-26 @ 4134.4 Signals.USAR-WSFG
Overall Rating
- Short-Term: Bearish,
- Intermediate-Term: Bearish,
- Long-Term: Bearish.
Key Insights Summary
Gold futures remain in a broad corrective downtrend with price pressed near the lower end of the recent range after a series of lower highs and lower lows. The weekly session fib structure stays bearish with price below the NTZ, while the monthly session still shows a constructive but fading intermediate recovery attempt above the monthly F0% area. Swing pivots are aligned bearish on both the short and intermediate horizon, and price remains under the 5, 10, 20, 55, 100, and 200 day benchmarks, reinforcing downside control across timeframes. The recent action shows a sharp selloff, a partial bounce, and then renewed weakness into early July, leaving the chart in a choppy, trend-retest phase rather than a clean bullish reversal. The current structure emphasizes rejection behavior around prior rally zones and continued pressure toward lower support references near the mid-3900s.
Chart Analysis ATS AI Generated: 2026-07-10 07:04 for Informational use only, not trading advice. Terms and Risk Disclosure Copyright © 2026. Algo Trading Systems LLC.