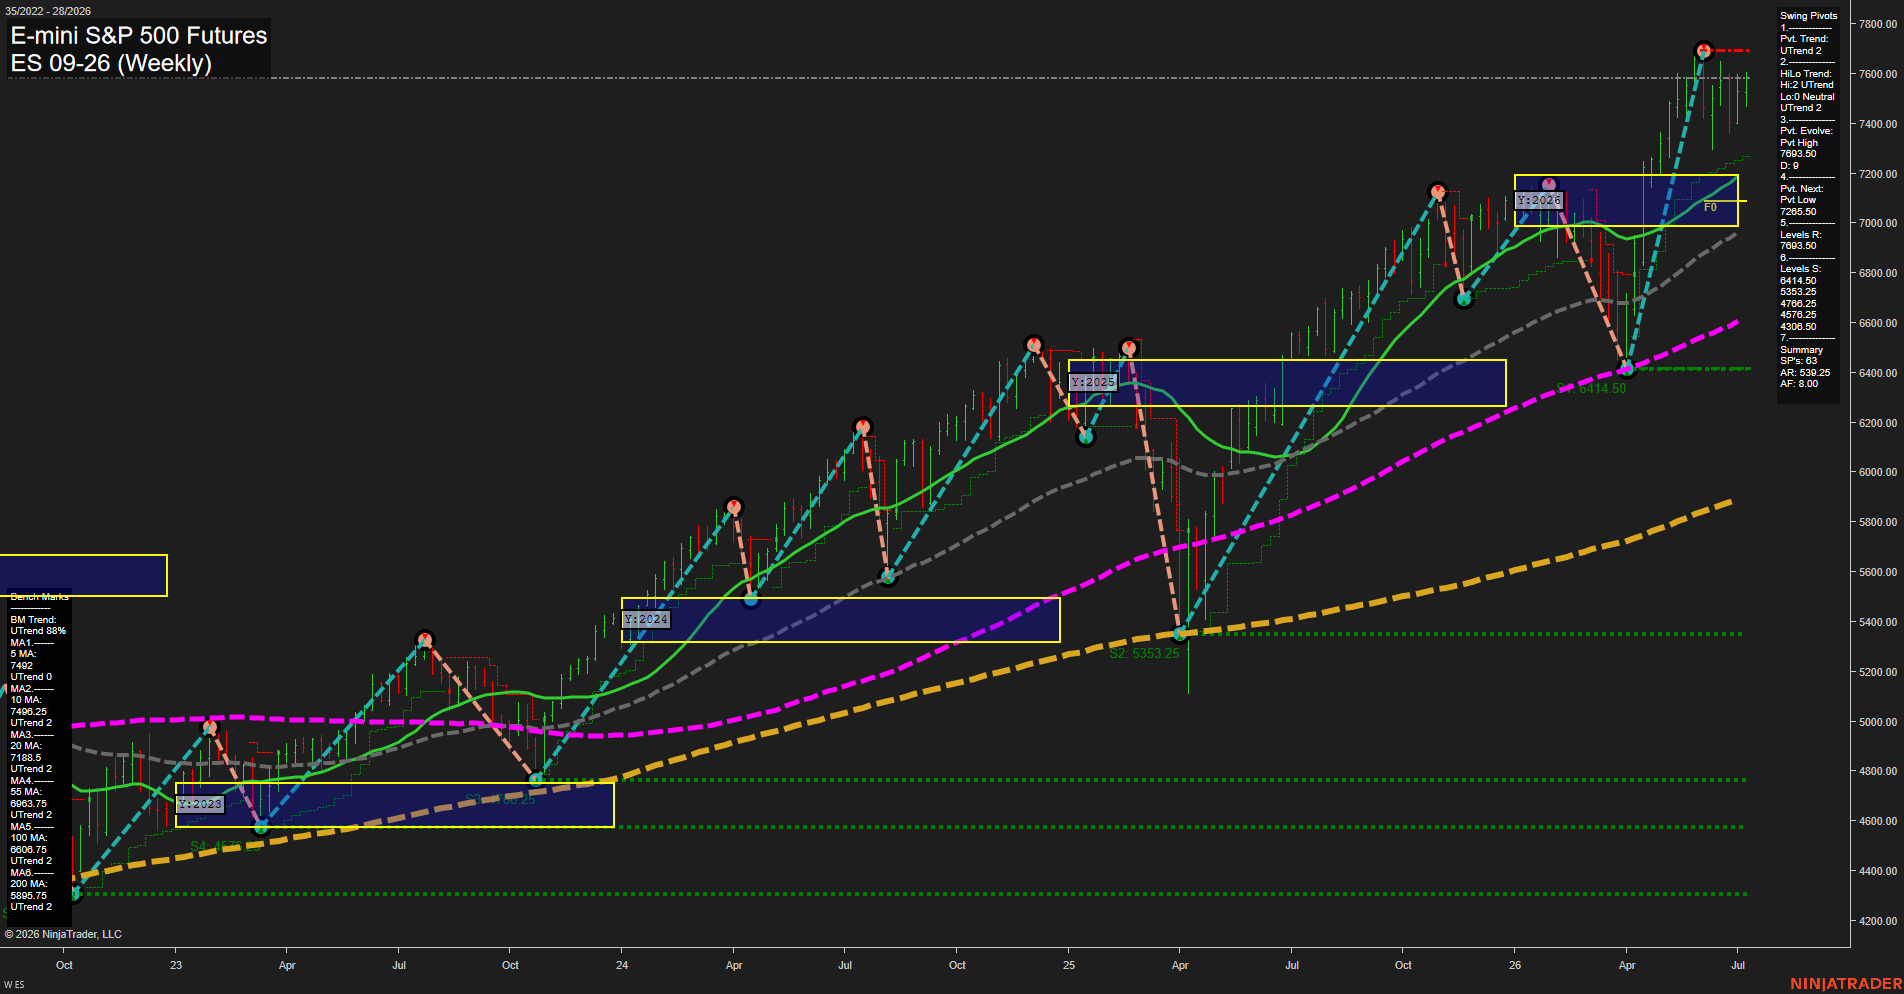
ES E-mini S&P 500 Futures Weekly Chart Analysis: 2026-Jul-10 07:03 CT
Price Action
- Last: 7590.25,
- Bars: Large,
- Mom: fast.
WSFG Weekly
- Short-Term
- WSFG Current: 10%
- F0%/NTZ' Bias: Price Above,
- WSFG Trend: Up.
MSFG Month Jul
- Intermediate-Term
- MSFG Current: 10%
- F0%/NTZ' Bias: Price Above,
- MSFG Trend: Up.
YSFG Year 2026
- Long-Term
- YSFG Current: 48%
- F0%/NTZ' Bias: Price Above,
- YSFG Trend: Up.
Swing Pivots
- (Short-Term) 1. Pvt. Trend: UTrend,
- (Intermediate-Term) 2. HiLo Trend: UTrend,
- 3. Pvt. Evolve: Pvt High 7693.50,
- 4. Pvt. Next: Pvt Low 7285.50,
- 5. Levels R: 7693.50,
- 6. Levels S: 6414.50, 5353.25, 4766.25, 4576.25, 4306.50.
Weekly Benchmarks
- (Short-Term) 5 Day: 7492.00 Up Trend,
- (Short-Term) 10 Day: 7496.25 Up Trend,
- (Intermediate-Term) 20 Day: 7188.50 Up Trend,
- (Intermediate-Term) 55 Day: 6963.75 Up Trend,
- (Long-Term) 100 Day: 6808.75 Up Trend,
- (Long-Term) 200 Day: 5895.75 Up Trend.
Recent Trade Signals
- 10 Jul 2026: Long ES 09-26 @ 7590.25 Signals.USAR-WSFG
- 10 Jul 2026: Long ES 09-26 @ 7588.5 Signals.USAR-MSFG
- 09 Jul 2026: Long ES 09-26 @ 7561.25 Signals.USAR.TR120
Overall Rating
- Short-Term: Bullish,
- Intermediate-Term: Bullish,
- Long-Term: Bullish.
Key Insights Summary
The weekly structure remains firmly in an established uptrend, with price holding above the yearly fib bias zone, all benchmark moving averages aligned in bullish sequence, and the pivot framework still pointing higher. The latest impulse has pushed price into the upper yearly session zone near prior highs, reflecting strong trend persistence rather than broad consolidation. Short-term momentum is fast and supported by consecutive long signals across WSFG, MSFG, and TR120, while the intermediate and long-term backdrop continues to show higher highs and higher lows with the major moving averages trending upward underneath price. The chart is trading near a breakout-extension area after a powerful rally, with the next major pivot resistance at 7693.50 and deeper structural supports well below in the 6400s, 5300s, and 4700s.
Chart Analysis ATS AI Generated: 2026-07-10 07:03 for Informational use only, not trading advice. Terms and Risk Disclosure Copyright © 2026. Algo Trading Systems LLC.