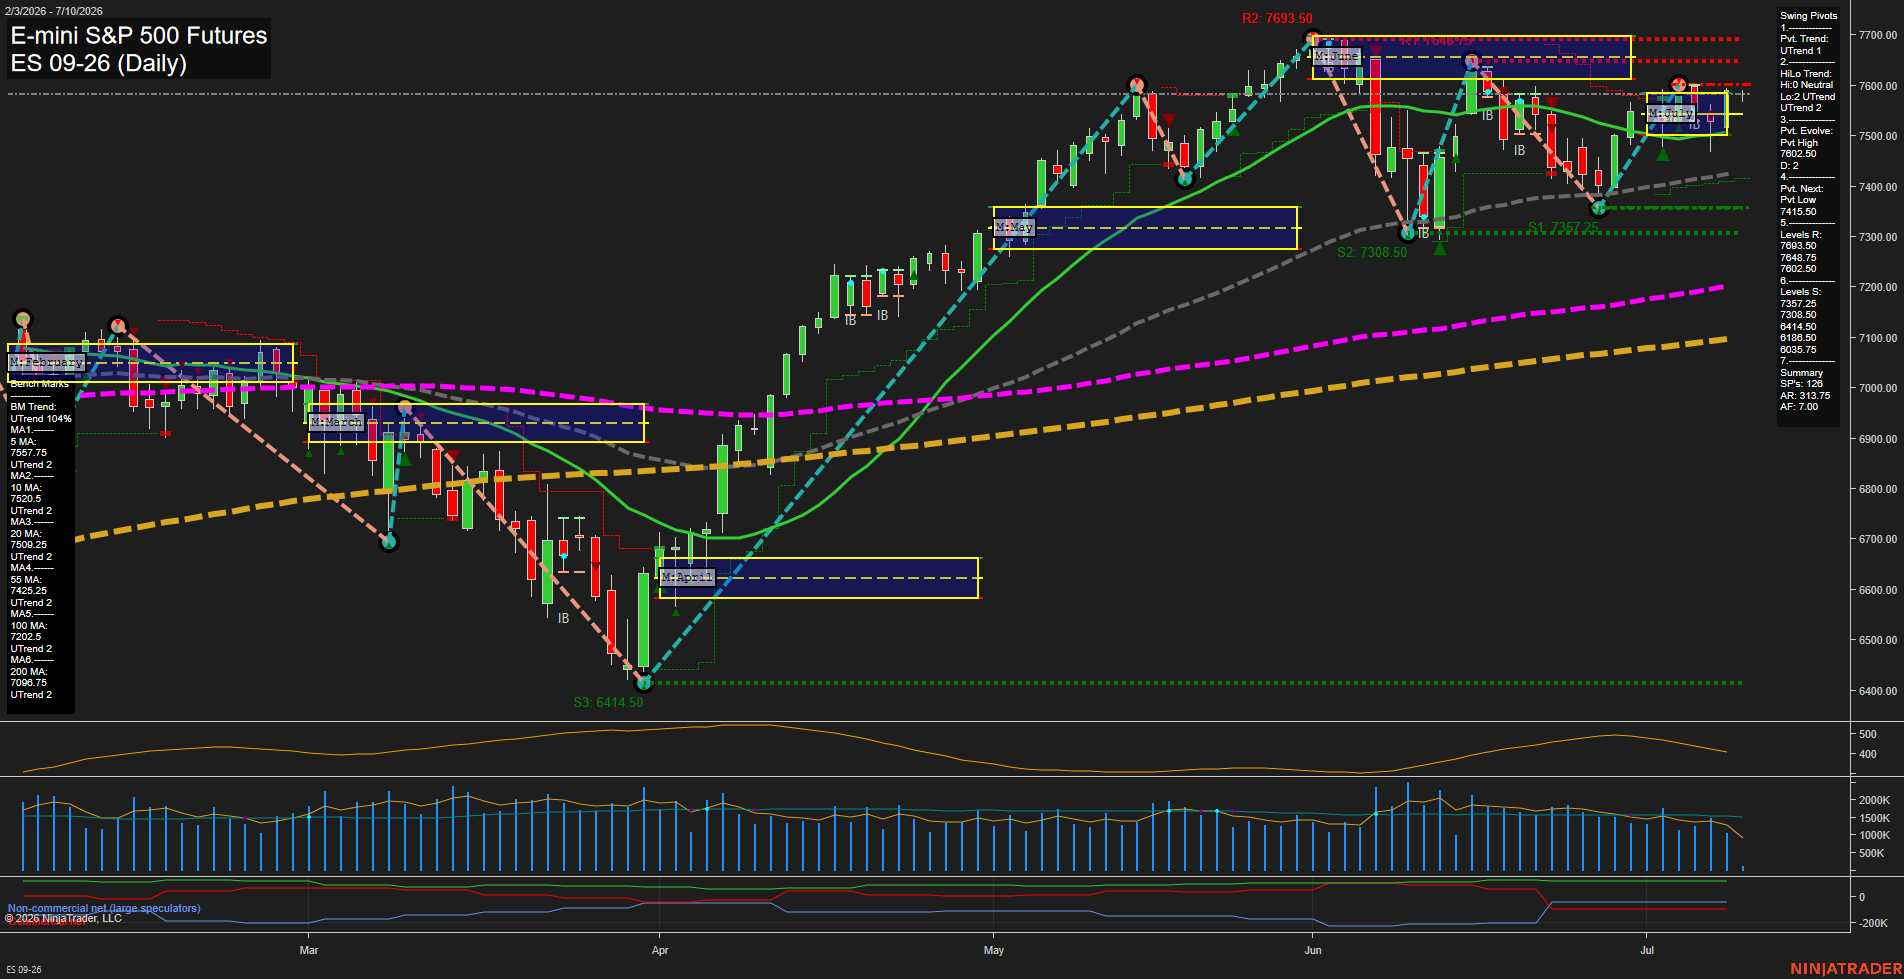
ES E-mini S&P 500 Futures Daily Chart Analysis: 2026-Jul-10 07:02 CT
Price Action
- Last: 7580.25,
- Bars: Medium,
- Mom: fast.
WSFG Weekly
- Short-Term
- WSFG Current: 10%
- F0%/NTZ' Bias: Price Above,
- WSFG Trend: Up.
MSFG Month Jul
- Intermediate-Term
- MSFG Current: 10%
- F0%/NTZ' Bias: Price Above,
- MSFG Trend: Up.
YSFG Year 2026
- Long-Term
- YSFG Current: 48%
- F0%/NTZ' Bias: Price Above,
- YSFG Trend: Up.
Swing Pivots
- (Short-Term) 1. Pvt. Trend: UTrend,
- (Intermediate-Term) 2. HiLo Trend: UTrend,
- 3. Pvt. Evolve: Pvt High 7602.50,
- 4. Pvt. Next: Pvt Low 7415.50,
- 5. Levels R: 7693.50, 7648.75, 7602.50,
- 6. Levels S: 7357.25, 7308.50, 6414.50, 6188.50, 6035.75.
Daily Benchmarks
- (Short-Term) 5 Day: 7557.75 Up Trend,
- (Short-Term) 10 Day: 7520.5 Up Trend,
- (Intermediate-Term) 20 Day: 7509.25 Up Trend,
- (Intermediate-Term) 55 Day: 7425.25 Up Trend,
- (Long-Term) 100 Day: 7202.5 Up Trend,
- (Long-Term) 200 Day: 7096.75 Up Trend.
Additional Metrics
- ATR: 319,
- VOLMA: 1611996.
Recent Trade Signals
- 10 Jul 2026: Long ES 09-26 @ 7590.25 Signals.USAR-WSFG
- 10 Jul 2026: Long ES 09-26 @ 7588.5 Signals.USAR-MSFG
- 09 Jul 2026: Long ES 09-26 @ 7561.25 Signals.USAR.TR120
Overall Rating
- Short-Term: Bullish,
- Intermediate-Term: Bullish,
- Long-Term: Bullish.
Key Insights Summary
The daily structure remains firmly constructive, with price holding above the weekly, monthly, and yearly fib grid center zones and staying well above all benchmark moving averages. The swing pivot framework remains in an active uptrend, with the last confirmed high at 7602.50 and the next meaningful pivot reference down at 7415.50, showing an elevated but still orderly bullish structure after the June rally. Recent action is characterized by a strong advance, a brief pullback from the upper pivot zone, and a rebound back into the upper range, which reflects ongoing trend rotation rather than a breakdown. The benchmark stack is fully bullish from 5-day through 200-day, supporting a broad trend alignment across short, intermediate, and long horizons. Recent long signals on WSFG, MSFG, and TR120 reinforce the upside trend profile, while the yearly fib position near mid-range suggests the larger 2026 trend still has room to extend within its current upward cycle.
Chart Analysis ATS AI Generated: 2026-07-10 07:03 for Informational use only, not trading advice. Terms and Risk Disclosure Copyright © 2026. Algo Trading Systems LLC.