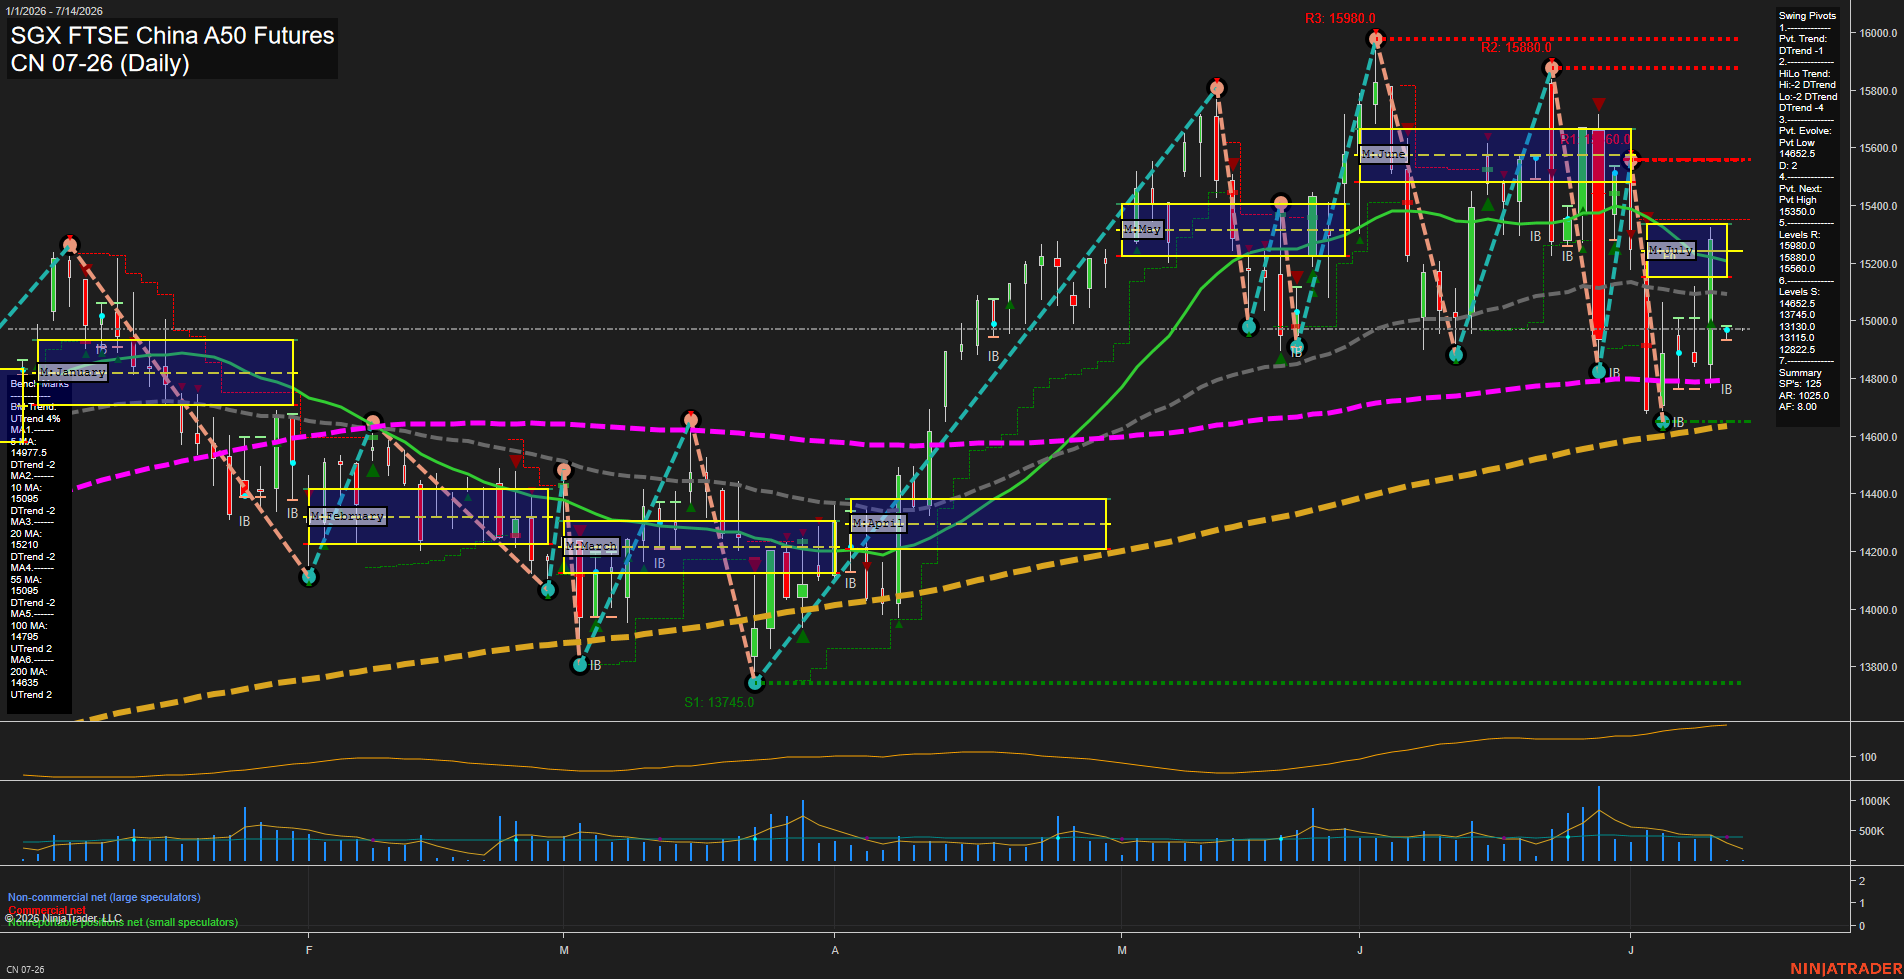
CN SGX FTSE China A50 Futures Daily Chart Analysis: 2026-Jul-10 07:02 CT
Price Action
- Last: 14975.0,
- Bars: Large,
- Mom: fast.
WSFG Weekly
- Short-Term
- WSFG Current: NA%
- F0%/NTZ' Bias: Price Neutral,
- WSFG Trend: Neutral.
MSFG Month Jul
- Intermediate-Term
- MSFG Current: NA%
- F0%/NTZ' Bias: Price Neutral,
- MSFG Trend: Neutral.
YSFG Year 2026
- Long-Term
- YSFG Current: NA%
- F0%/NTZ' Bias: Price Neutral,
- YSFG Trend: Neutral.
Swing Pivots
- (Short-Term) 1. Pvt. Trend: DTrend,
- (Intermediate-Term) 2. HiLo Trend: DTrend,
- 3. Pvt. Evolve: Pvt Low 14652.5,
- 4. Pvt. Next: Pvt High 15350.0,
- 5. Levels R: 15980.0, 15880.0, 15560.0,
- 6. Levels S: 14652.5, 13745.0.
Daily Benchmarks
- (Short-Term) 5 Day: 14977.5 Down Trend,
- (Short-Term) 10 Day: 15095.0 Down Trend,
- (Intermediate-Term) 20 Day: 15210.0 Down Trend,
- (Intermediate-Term) 55 Day: 15095.0 Down Trend,
- (Long-Term) 100 Day: 14795.0 Up Trend,
- (Long-Term) 200 Day: 14635.0 Up Trend.
Additional Metrics
- ATR: 87.5,
- VOLMA: 261842.
Overall Rating
- Short-Term: Bearish,
- Intermediate-Term: Bearish,
- Long-Term: Neutral.
Key Insights Summary
Price is trading in a volatile, two-sided swing structure after a strong rally to the 15,980 / 15,880 resistance band and a sharp rejection back toward the mid-14,900s. The short-term pivot structure remains in DTrend, with lower highs and lower lows still defining the active swing rhythm, while the HiLo pivot read also remains negative. Daily benchmarks are mixed but tilt soft in the near term because price is below the 5, 10, 20, and 55 day averages, even though the 100 and 200 day measures still slope higher, showing the broader trend has not fully broken down. ATR is elevated and volume remains active, consistent with a fast-moving consolidation phase where breakout attempts, failed retests, and intraday reversal bars have been frequent. Overall, the chart reflects a corrective pullback within a larger cyclical advance, with overhead resistance clustered above and the longer-term trend still healthier than the short-term tape.
Chart Analysis ATS AI Generated: 2026-07-10 07:02 for Informational use only, not trading advice. Terms and Risk Disclosure Copyright © 2026. Algo Trading Systems LLC.