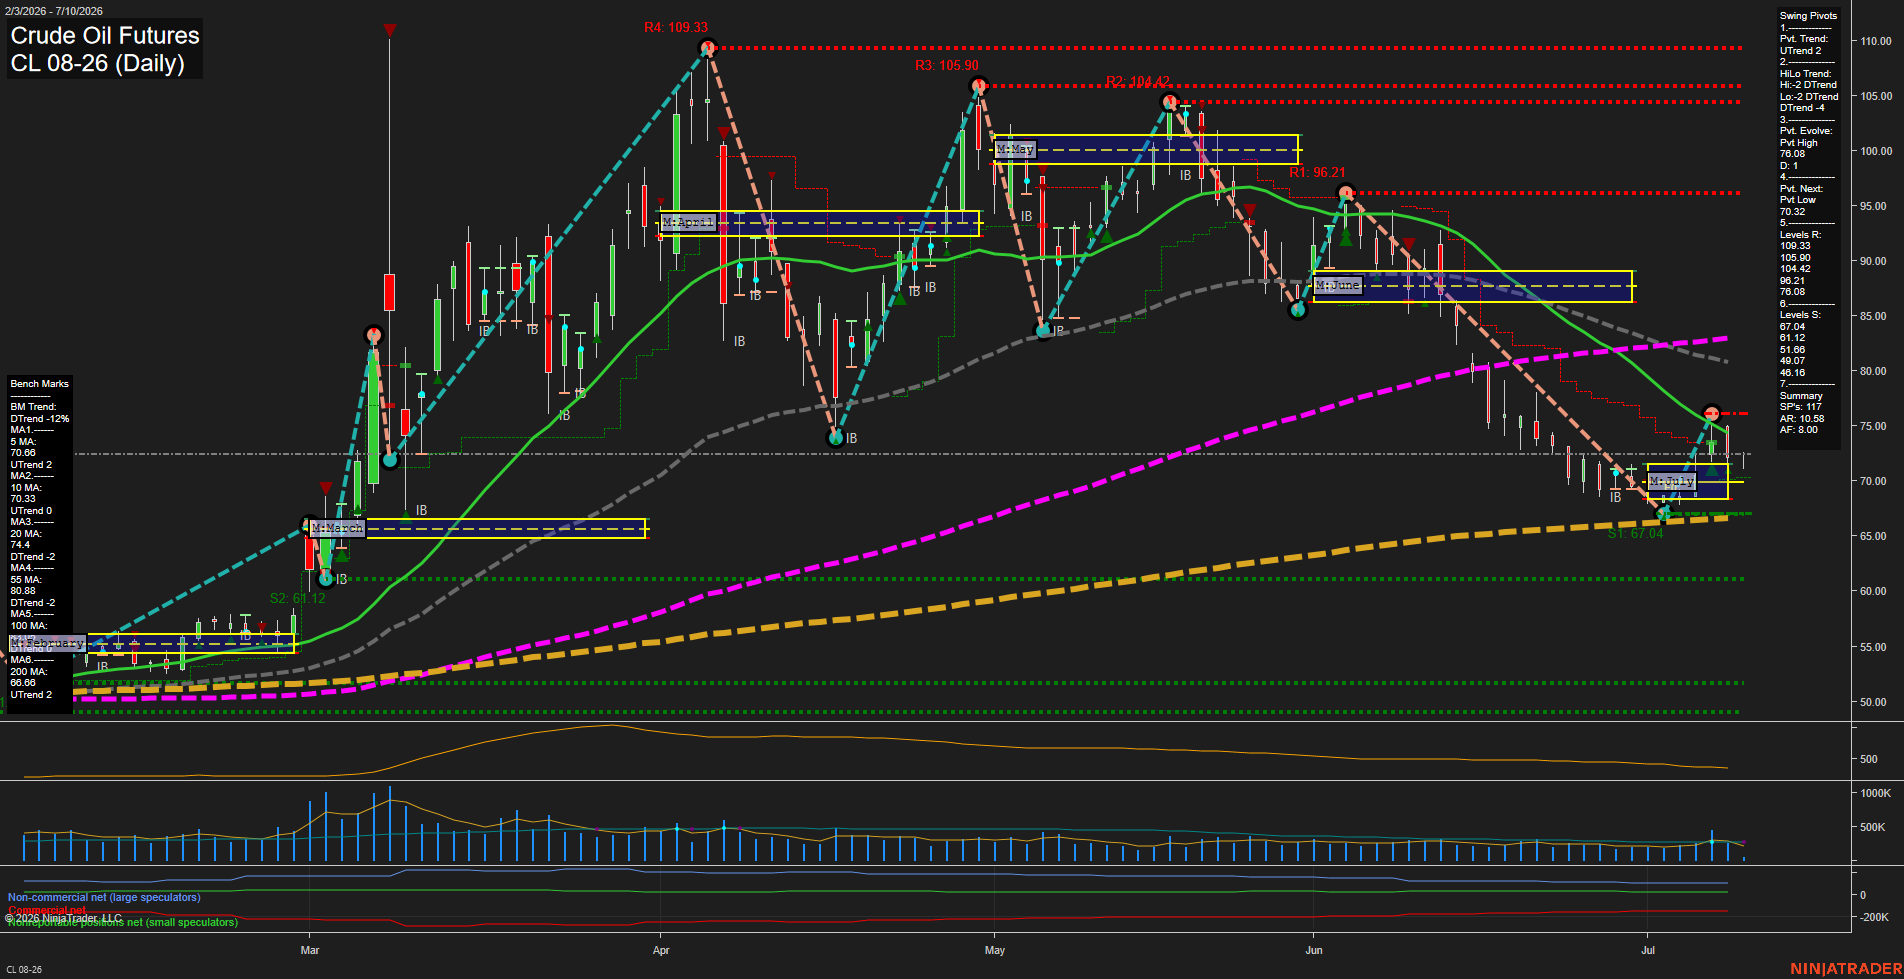
CL Crude Oil Futures Daily Chart Analysis: 2026-Jul-10 07:01 CT
Price Action
- Last: 74.53,
- Bars: Large,
- Mom: fast.
WSFG Weekly
- Short-Term
- WSFG Current: 49%
- F0%/NTZ' Bias: Price Above,
- WSFG Trend: Up.
MSFG Month Jul
- Intermediate-Term
- MSFG Current: 11%
- F0%/NTZ' Bias: Price Above,
- MSFG Trend: Up.
YSFG Year 2026
- Long-Term
- YSFG Current: 77%
- F0%/NTZ' Bias: Price Above,
- YSFG Trend: Up.
Swing Pivots
- (Short-Term) 1. Pvt. Trend: UTrend,
- (Intermediate-Term) 2. HiLo Trend: DTrend,
- 3. Pvt. Evolve: Pvt High 76.08,
- 4. Pvt. Next: Pvt Low 70.32,
- 5. Levels R: 109.33, 105.90, 104.42, 96.21, 76.08,
- 6. Levels S: 67.04, 61.12, 51.66, 49.07, 46.80.
Daily Benchmarks
- (Short-Term) 5 Day: 70.68 Up Trend,
- (Short-Term) 10 Day: 70.33 Up Trend,
- (Intermediate-Term) 20 Day: 74.40 Down Trend,
- (Intermediate-Term) 55 Day: 80.88 Down Trend,
- (Long-Term) 100 Day: 86.03 Down Trend,
- (Long-Term) 200 Day: 68.86 Up Trend.
Additional Metrics
Recent Trade Signals
- 09 Jul 2026: Short CL 08-26 @ 72.14 Signals.USAR.TR120
- 09 Jul 2026: Long CL 08-26 @ 73.51 Signals.USAR-MSFG
- 08 Jul 2026: Long CL 08-26 @ 75.84 Signals.USAR.TR720
- 07 Jul 2026: Long CL 08-26 @ 70.04 Signals.USAR-WSFG
Overall Rating
- Short-Term: Neutral,
- Intermediate-Term: Bearish,
- Long-Term: Neutral.
Key Insights Summary
Crude oil is in a volatile downtrend with a sharp selloff into the low 70s followed by a fast bounce, leaving price below the 20/55/100-day benchmarks but still above the 200-day average. The short-term pivot structure has flipped to UTrend while the broader HiLo pivot profile remains DTrend, showing a countertrend recovery inside a larger corrective sequence. Weekly and monthly fib grids both show price above the NTZ midpoint bias, yet the monthly session remains very compressed at 11%, reflecting an extended move that has recently rotated lower and then stabilized. The recent signal sequence shows alternating long and short triggers, consistent with a choppy transition phase rather than a clean trend continuation. Longer-term structure is still anchored by the rising 200-day and the positive yearly fib bias, while the intermediate moving averages continue to lean lower, keeping the broader profile mixed to bearish.
Chart Analysis ATS AI Generated: 2026-07-10 07:02 for Informational use only, not trading advice. Terms and Risk Disclosure Copyright © 2026. Algo Trading Systems LLC.