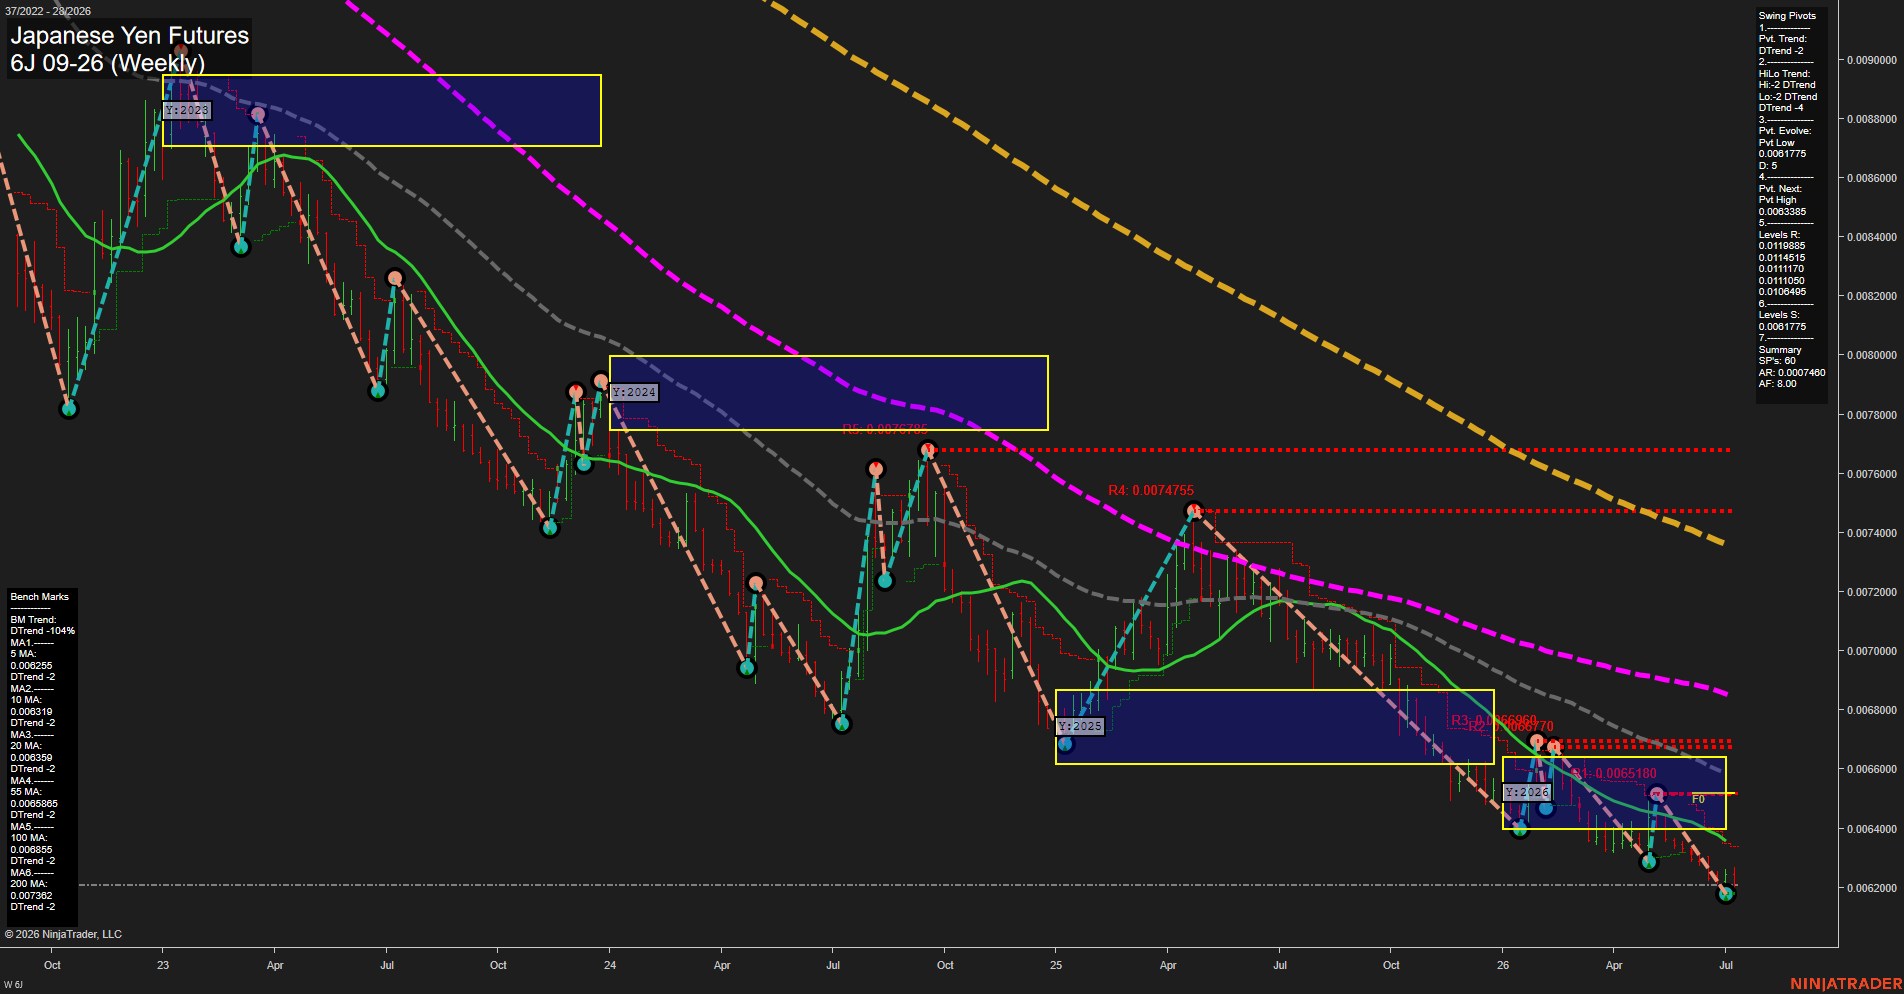
6J Japanese Yen Futures Weekly Chart Analysis: 2026-Jul-10 07:01 CT
Price Action
- Last: 0.006223,
- Bars: Small,
- Mom: slow.
WSFG Weekly
- Short-Term
- WSFG Current: -40%
- F0%/NTZ' Bias: Price Below,
- WSFG Trend: Down.
MSFG Month Jul
- Intermediate-Term
- MSFG Current: 18%
- F0%/NTZ' Bias: Price Above,
- MSFG Trend: Up.
YSFG Year 2026
- Long-Term
- YSFG Current: -25%
- F0%/NTZ' Bias: Price Below,
- YSFG Trend: Down.
Swing Pivots
- (Short-Term) 1. Pvt. Trend: DTrend,
- (Intermediate-Term) 2. HiLo Trend: DTrend,
- 3. Pvt. Evolve: Pvt Low 0.0067175,
- 4. Pvt. Next: Pvt High 0.0063385,
- 5. Levels R: 0.0119885, 0.0114515, 0.0111170, 0.0110500, 0.0106495,
- 6. Levels S: 0.0061775.
Weekly Benchmarks
- (Short-Term) 5 Day: 0.006255 Down Trend,
- (Short-Term) 10 Day: 0.006319 Down Trend,
- (Intermediate-Term) 20 Day: 0.006359 Down Trend,
- (Intermediate-Term) 55 Day: 0.006585 Down Trend,
- (Long-Term) 100 Day: 0.006855 Down Trend,
- (Long-Term) 200 Day: 0.007382 Down Trend.
Recent Trade Signals
- 10 Jul 2026: Long 6J 09-26 @ 0.006223 Signals.USAR.TR120
- 10 Jul 2026: Long 6J 09-26 @ 0.0062145 Signals.USAR-MSFG
- 06 Jul 2026: Short 6J 09-26 @ 0.006225 Signals.USAR-WSFG
Overall Rating
- Short-Term: Bearish,
- Intermediate-Term: Neutral,
- Long-Term: Bearish.
Key Insights Summary
Japanese Yen Futures remain in a broader downtrend with price pressing near fresh cycle lows and trading beneath all weekly benchmarks, which keeps the short-term and long-term structure heavy. The weekly WSFG remains negative and the swing pivot structure is still DTrend, confirming lower highs and lower lows. At the same time, the July monthly session fib grid is positive, showing a constructive intermediate backdrop that is trying to stabilize against the larger bearish weekly and yearly pressure. Recent signals reflect that split: short-term weakness was triggered earlier in the week, while the latest session registered long signals from TR120 and MSFG. Overall, the chart is still dominated by a downtrend, but the monthly fib position and recent rebound signals indicate a mixed, transition-like phase rather than a clean trend acceleration.
Chart Analysis ATS AI Generated: 2026-07-10 07:01 for Informational use only, not trading advice. Terms and Risk Disclosure Copyright © 2026. Algo Trading Systems LLC.