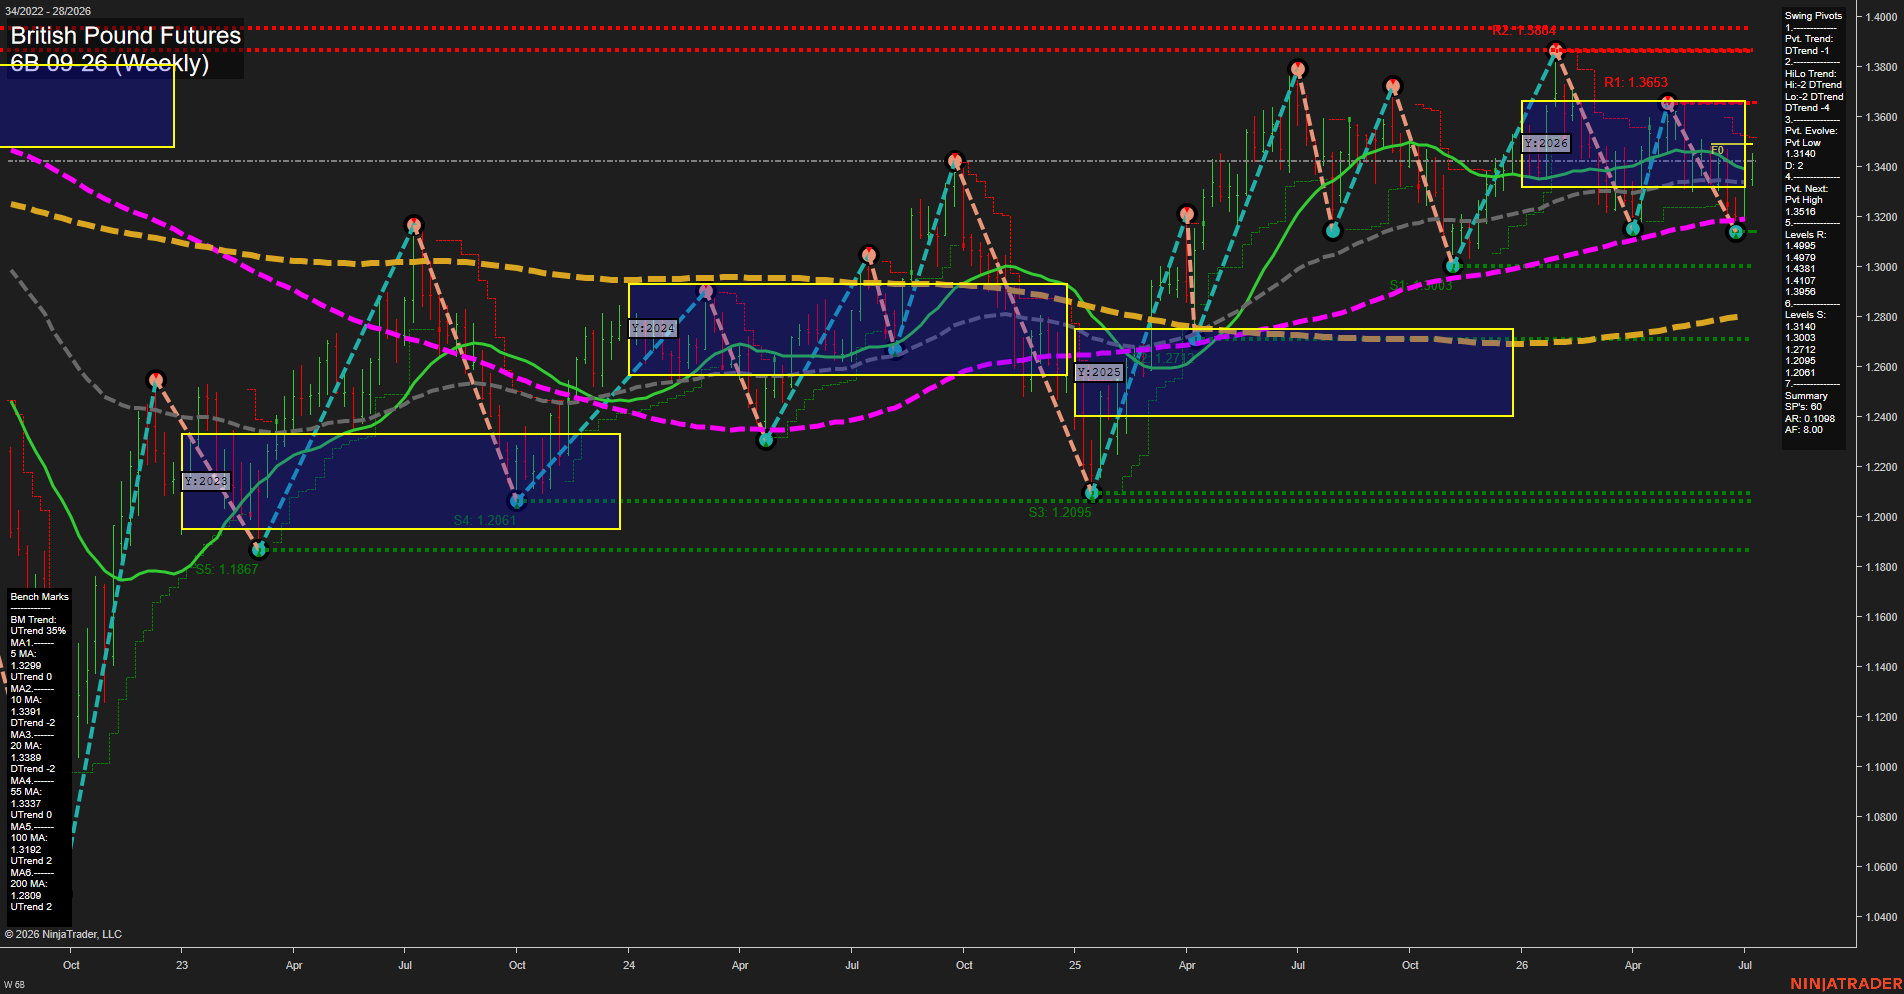
6B British Pound Futures Weekly Chart Analysis: 2026-Jul-10 07:00 CT
Price Action
- Last: 1.3140,
- Bars: Large,
- Mom: Fast.
WSFG Weekly
- Short-Term
- WSFG Current: 38%
- F0%/NTZ' Bias: Price Above,
- WSFG Trend: Up.
MSFG Month Jul
- Intermediate-Term
- MSFG Current: 52%
- F0%/NTZ' Bias: Price Above,
- MSFG Trend: Up.
YSFG Year 2026
- Long-Term
- YSFG Current: -4%
- F0%/NTZ' Bias: Price Below,
- YSFG Trend: Down.
Swing Pivots
- (Short-Term) 1. Pvt. Trend: DTrend,
- (Intermediate-Term) 2. HiLo Trend: DTrend,
- 3. Pvt. Evolve: Pvt Low 1.3140,
- 4. Pvt. Next: Pvt High 1.3516,
- 5. Levels R: 1.4995, 1.4799, 1.4381, 1.4107, 1.3958,
- 6. Levels S: 1.3140, 1.3003, 1.2712, 1.2095, 1.2061, 1.1867.
Weekly Benchmarks
- (Short-Term) 5 Day: 1.3299 Up Trend,
- (Short-Term) 10 Day: 1.3391 Down Trend,
- (Intermediate-Term) 20 Day: 1.3389 Down Trend,
- (Intermediate-Term) 55 Day: 1.3337 Up Trend,
- (Long-Term) 100 Day: 1.3192 Up Trend,
- (Long-Term) 200 Day: 1.2809 Up Trend.
Recent Trade Signals
- 08 Jul 2026: Long 6B 09-26 @ 1.3401 Signals.USAR.TR120
- 08 Jul 2026: Long 6B 09-26 @ 1.3385 Signals.USAR-WSFG
- 02 Jul 2026: Long 6B 09-26 @ 1.3361 Signals.USAR.TR720
- 02 Jul 2026: Long 6B 09-26 @ 1.3291 Signals.USAR-MSFG
Overall Rating
- Short-Term: Bearish,
- Intermediate-Term: Bullish,
- Long-Term: Neutral.
Key Insights Summary
Weekly price action remains in a broad uptrend structure, but the current swing has rolled over from the recent highs and is pressing back toward the 1.3140 pivot support. The weekly and monthly session fib grids both hold above their midlines, which keeps the intermediate structure constructive, while the yearly grid remains below its midpoint and continues to define the larger long-term pullback environment. Swing pivot structure has shifted to DTrend with HiLo also DTrend, showing a short-term lower-high/lower-low sequence. Benchmarks are mixed: the 5-day is above price supportively, but the 10-day and 20-day are still pointing down, while the 55-day, 100-day, and 200-day stay rising underneath. Recent signals remain long, reflecting the broader trend-following bias even as the latest weekly leg is retracing from the upper swing zone near 1.3516 and below the heavier resistance band overhead.
Chart Analysis ATS AI Generated: 2026-07-10 07:00 for Informational use only, not trading advice. Terms and Risk Disclosure Copyright © 2026. Algo Trading Systems LLC.