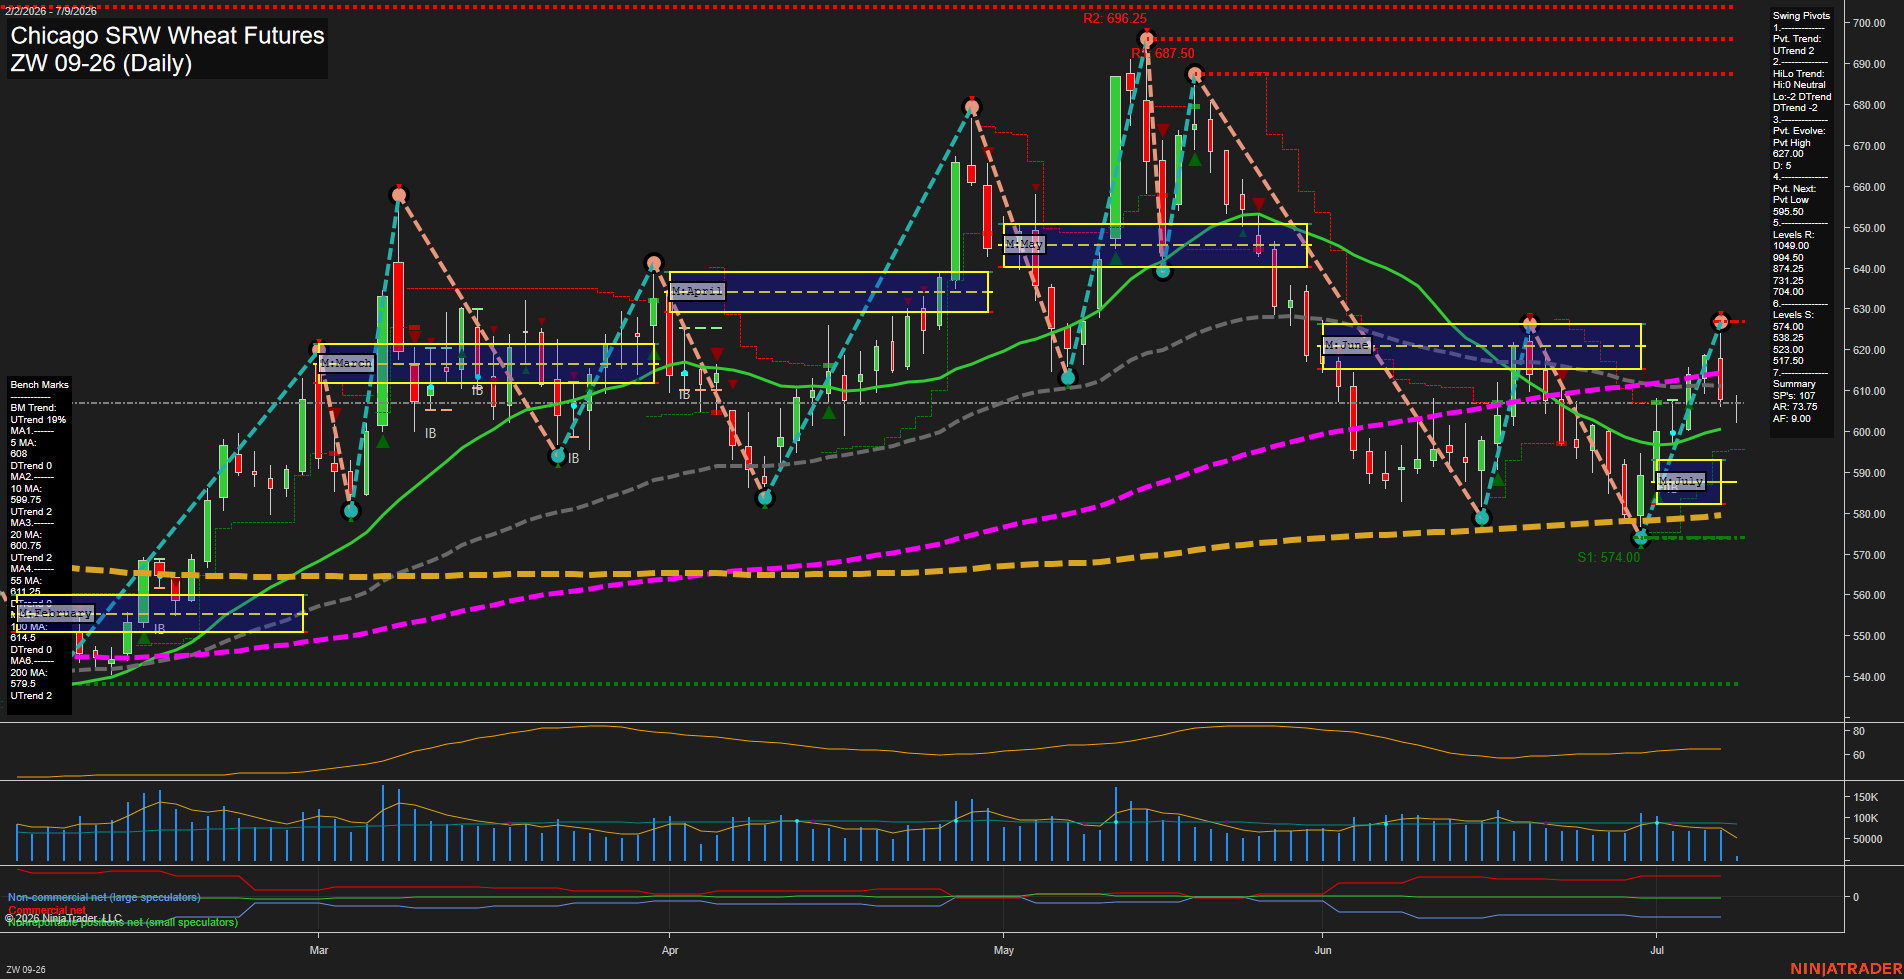
ZW Chicago SRW Wheat Futures Daily Chart Analysis: 2026-Jul-09 07:10 CT
Price Action
- Last: 609.50,
- Bars: Large,
- Mom: Fast.
WSFG Weekly
- Short-Term
- WSFG Current: 18%
- F0%/NTZ' Bias: Price Above,
- WSFG Trend: Up.
MSFG Month Jul
- Intermediate-Term
- MSFG Current: 12%
- F0%/NTZ' Bias: Price Above,
- MSFG Trend: Up.
YSFG Year 2026
- Long-Term
- YSFG Current: 30%
- F0%/NTZ' Bias: Price Above,
- YSFG Trend: Up.
Swing Pivots
- (Short-Term) 1. Pvt. Trend: UTrend,
- (Intermediate-Term) 2. HiLo Trend: DTrend,
- 3. Pvt. Evolve: Pvt High 627.00,
- 4. Pvt. Next: Pvt Low 595.50,
- 5. Levels R: 1049.00, 994.50, 874.25, 731.25, 704.00,
- 6. Levels S: 574.00, 538.25, 523.00, 517.50.
Daily Benchmarks
- (Short-Term) 5 Day: 608.00 Up Trend,
- (Short-Term) 10 Day: 599.75 Up Trend,
- (Intermediate-Term) 20 Day: 600.75 Up Trend,
- (Intermediate-Term) 55 Day: 611.25 Up Trend,
- (Long-Term) 100 Day: 614.50 Up Trend,
- (Long-Term) 200 Day: 579.50 Up Trend.
Additional Metrics
Recent Trade Signals
- 07 Jul 2026: Long ZW 09-26 @ 614.75 Signals.USAR.TR720
- 06 Jul 2026: Long ZW 09-26 @ 606.5 Signals.USAR-MSFG
- 06 Jul 2026: Long ZW 09-26 @ 604.5 Signals.USAR-WSFG
Overall Rating
- Short-Term: Bullish,
- Intermediate-Term: Neutral,
- Long-Term: Neutral.
Key Insights Summary
Wheat remains in a broader uptrend structure, but the latest daily swing is a sharp retracement from the 620s back into the low 610s area after rejecting the recent June/July high cluster near 627. The short-term picture is still constructive because price is holding above the weekly and monthly session fib bias zones and remains above the 20-day benchmark, yet momentum has accelerated lower into the current pullback. Intermediate trend structure is mixed, with pivot evolution still pointing to a prior high while the hi/lo pivot track is weaker, showing a transition from expansion to consolidation. The market is sitting below the 55-day and 100-day benchmarks while remaining above the 200-day, which keeps the longer context neutral rather than outright bearish. Overall, the chart reflects a volatile trend-and-pullback environment with repeated higher-low attempts, failed upside extensions, and a market now working through a retracement inside a still-active larger bullish cycle.
Chart Analysis ATS AI Generated: 2026-07-09 07:10 for Informational use only, not trading advice. Terms and Risk Disclosure Copyright © 2026. Algo Trading Systems LLC.