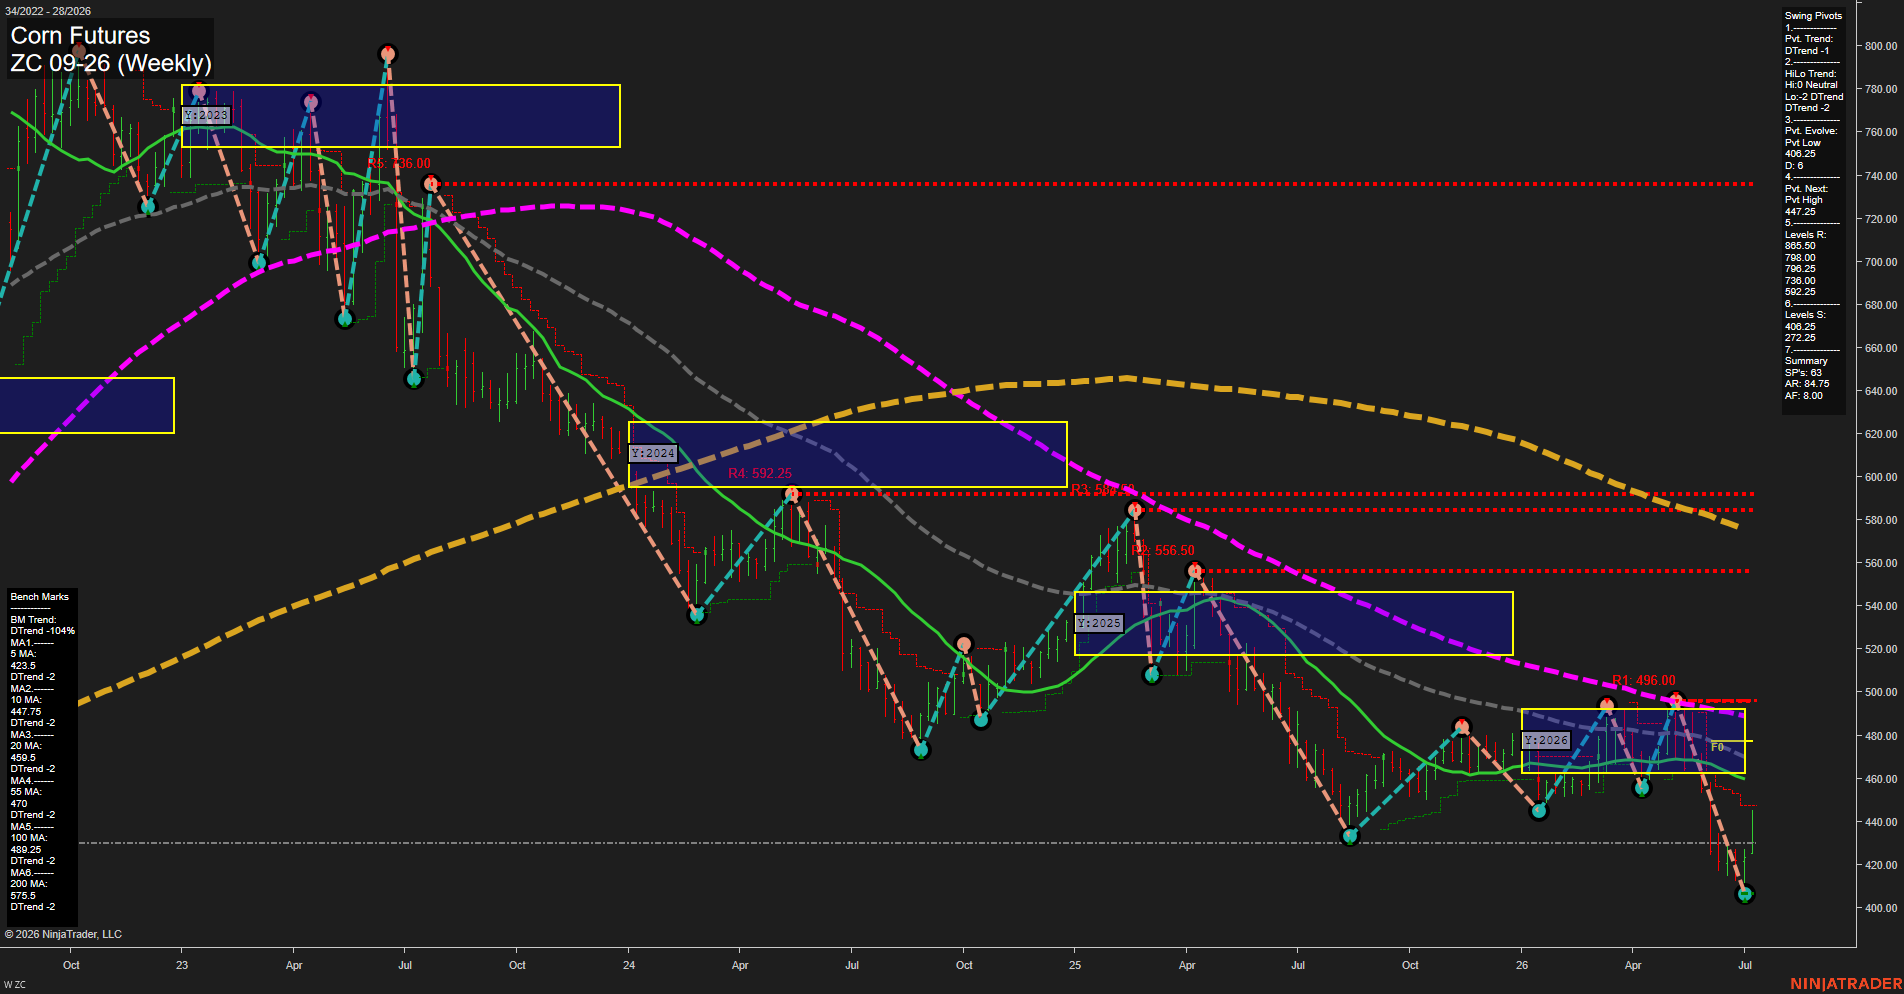
ZC Corn Futures Weekly Chart Analysis: 2026-Jul-09 07:09 CT
Price Action
- Last: 406.25,
- Bars: Medium,
- Mom: fast.
WSFG Weekly
- Short-Term
- WSFG Current: 32%
- F0%/NTZ' Bias: Price Above,
- WSFG Trend: Up.
MSFG Month Jul
- Intermediate-Term
- MSFG Current: 27%
- F0%/NTZ' Bias: Price Above,
- MSFG Trend: Up.
YSFG Year 2026
- Long-Term
- YSFG Current: -31%
- F0%/NTZ' Bias: Price Below,
- YSFG Trend: Down.
Swing Pivots
- (Short-Term) 1. Pvt. Trend: DTrend,
- (Intermediate-Term) 2. HiLo Trend: DTrend,
- 3. Pvt. Evolve: Pvt Low 406.25,
- 4. Pvt. Next: Pvt High 447.25,
- 5. Levels R: 865.50, 798.25, 798.00, 738.00, 592.25,
- 6. Levels S: 406.25, 272.25.
Weekly Benchmarks
- (Short-Term) 5 Day: 423.5 Down Trend,
- (Short-Term) 10 Day: 447.75 Down Trend,
- (Intermediate-Term) 20 Day: 459.5 Down Trend,
- (Intermediate-Term) 55 Day: 470 Down Trend,
- (Long-Term) 100 Day: 489.25 Down Trend,
- (Long-Term) 200 Day: 575.5 Down Trend.
Recent Trade Signals
- 08 Jul 2026: Short ZC 09-26 @ 435.25 Signals.USAR.TR120
- 06 Jul 2026: Long ZC 09-26 @ 430.25 Signals.USAR.TR720
- 02 Jul 2026: Long ZC 09-26 @ 423.75 Signals.USAR-WSFG
- 02 Jul 2026: Long ZC 09-26 @ 426.5 Signals.USAR-MSFG
Overall Rating
- Short-Term: Bearish,
- Intermediate-Term: Bearish,
- Long-Term: Bearish.
Key Insights Summary
Corn futures are in a broad weekly downtrend with a fast downside impulse into the 406.25 pivot low, leaving price below all major benchmarks and well under the 20, 55, 100, and 200-day averages. The short-term and monthly session grids remain above their F0%/NTZ reference, but the swing pivot structure has flipped to DTrend with the next upside pivot defined at 447.25, showing the market is in a lower-low sequence rather than a recovery sequence. The recent signal flow is mixed across timeframes, but the latest short signal aligns with the dominant bearish weekly structure. The larger picture remains pressured by the year 2026 grid sitting below F0%/NTZ, while the chart shows a sharp selloff following a choppy consolidation band, indicating downside continuation has reasserted control after prior countertrend bounces.
Chart Analysis ATS AI Generated: 2026-07-09 07:10 for Informational use only, not trading advice. Terms and Risk Disclosure Copyright © 2026. Algo Trading Systems LLC.