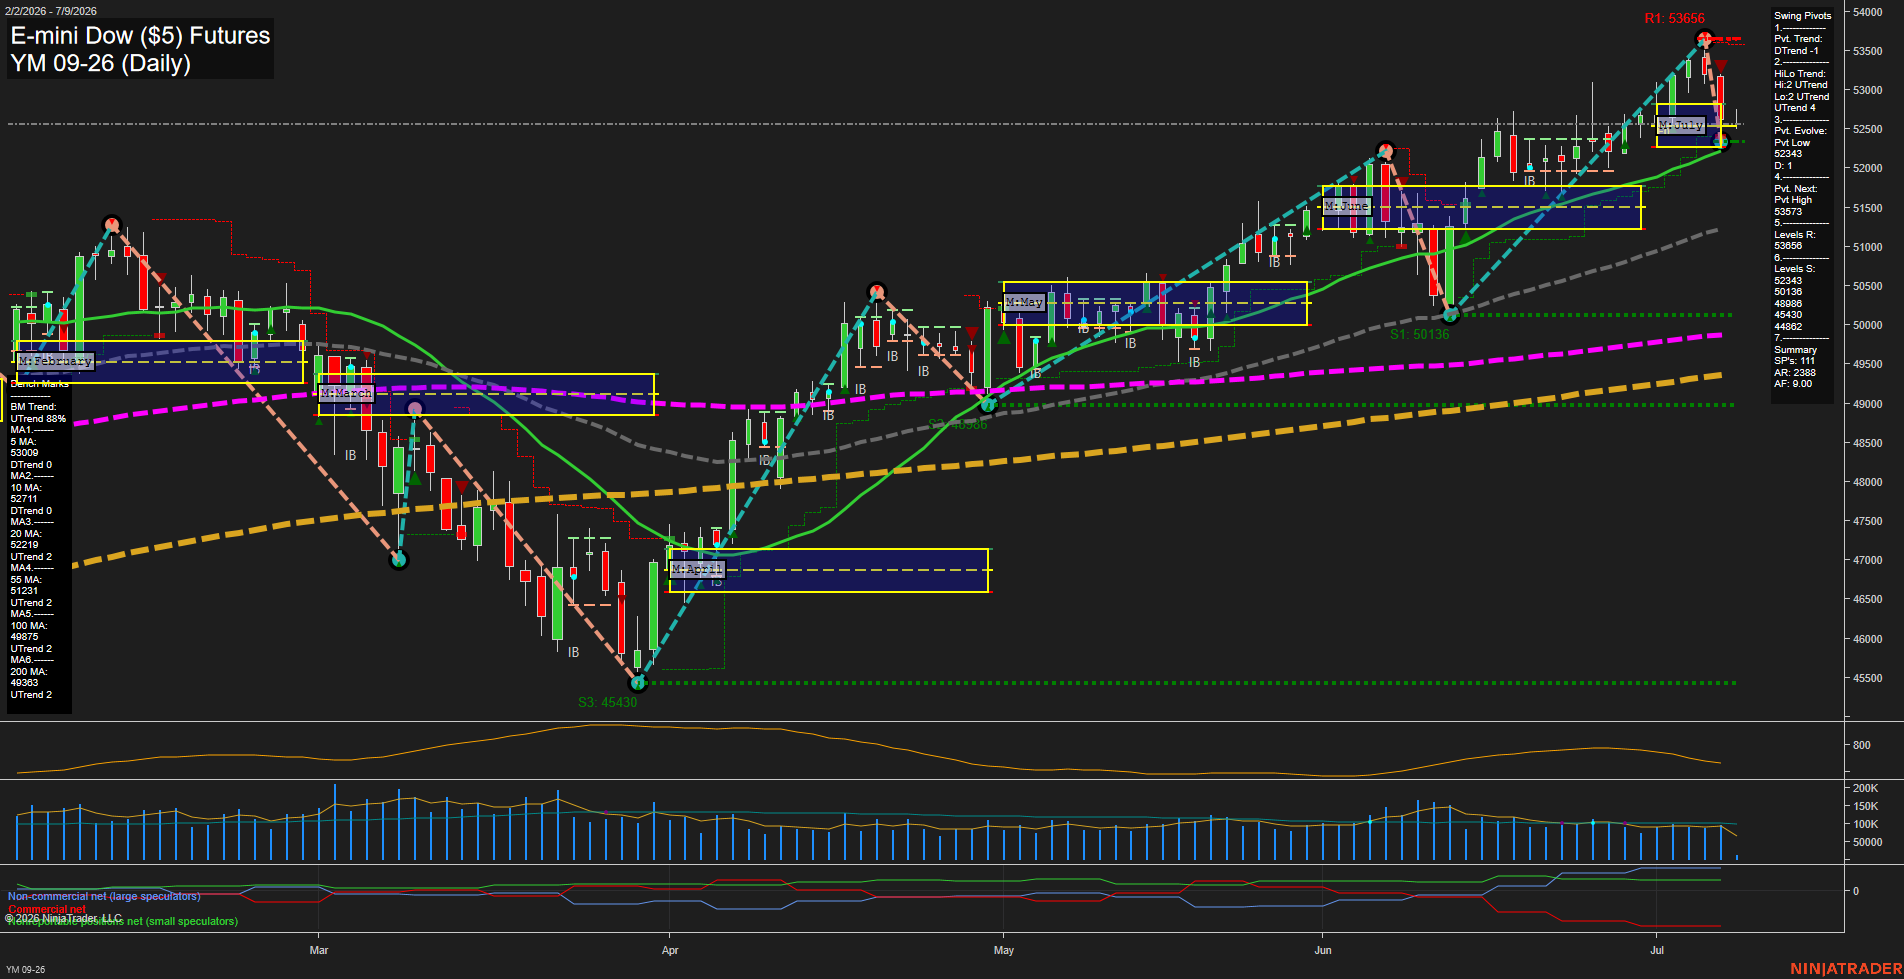
YM E-mini Dow ($5) Futures Daily Chart Analysis: 2026-Jul-09 07:09 CT
Price Action
- Last: 52400,
- Bars: Large,
- Mom: average.
WSFG Weekly
- Short-Term
- WSFG Current: -48%
- F0%/NTZ' Bias: Price Below,
- WSFG Trend: Down.
MSFG Month Jul
- Intermediate-Term
- MSFG Current: 3%
- F0%/NTZ' Bias: Price Above,
- MSFG Trend: Up.
YSFG Year 2026
- Long-Term
- YSFG Current: 41%
- F0%/NTZ' Bias: Price Above,
- YSFG Trend: Up.
Swing Pivots
- (Short-Term) 1. Pvt. Trend: DTrend,
- (Intermediate-Term) 2. HiLo Trend: UTrend,
- 3. Pvt. Evolve: Pvt Low 52343,
- 4. Pvt. Next: Pvt High 53573,
- 5. Levels R: 53656, 53573,
- 6. Levels S: 52343, 50136, 48986, 45430.
Daily Benchmarks
- (Short-Term) 5 Day: 53009 Down Trend,
- (Short-Term) 10 Day: 52711 Down Trend,
- (Intermediate-Term) 20 Day: 52219 Up Trend,
- (Intermediate-Term) 55 Day: 51231 Up Trend,
- (Long-Term) 100 Day: 49875 Up Trend,
- (Long-Term) 200 Day: 49363 Up Trend.
Additional Metrics
- ATR: 2388,
- VOLMA: 108292.
Recent Trade Signals
- 08 Jul 2026: Short YM 09-26 @ 53057 Signals.USAR-WSFG
- 08 Jul 2026: Short YM 09-26 @ 53117 Signals.USAR.TR120
- 07 Jul 2026: Long YM 09-26 @ 53217 Signals.USAR-MSFG
Overall Rating
- Short-Term: Bearish,
- Intermediate-Term: Bullish,
- Long-Term: Bullish.
Key Insights Summary
The chart remains structurally constructive on the higher time frames, with July monthly and 2026 yearly session grids both holding above F0% and trending up, while the long-term benchmark stack stays firmly positive and rising. Short-term tone has weakened after the recent push to the 53,656 area and the selloff back toward 52,343, with the daily pivot trend flipping to DTrend and price trading below the 5-day and 10-day averages. The intermediate picture is still supported by price holding above the 20-day and 55-day benchmarks, and the active swing framework shows a reset from the prior high into a new low pivot, keeping the next reference point at 53,573. Overall, the action looks like a broad uptrend with a near-term pullback and a test of prior breakout territory, not a full trend breakdown.
Chart Analysis ATS AI Generated: 2026-07-09 07:09 for Informational use only, not trading advice. Terms and Risk Disclosure Copyright © 2026. Algo Trading Systems LLC.