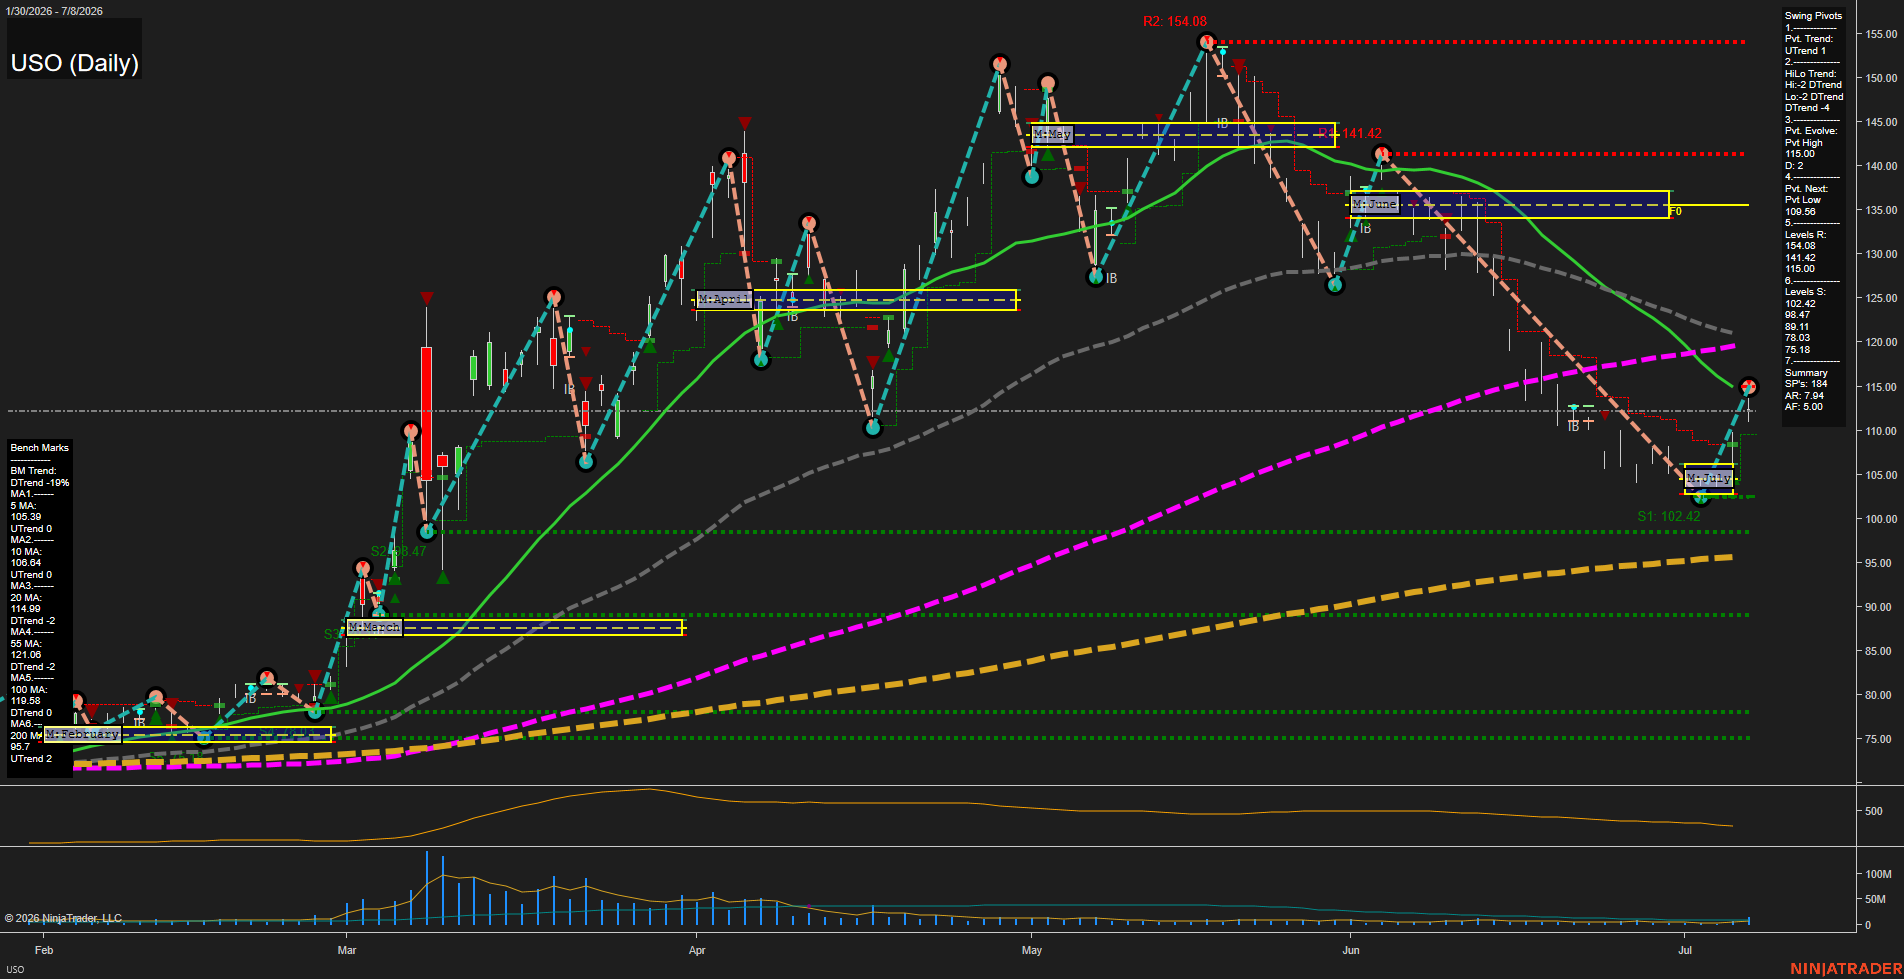
USO United States Oil Fund LP Daily Chart Analysis: 2026-Jul-09 07:08 CT
Price Action
- Last: 115.00,
- Bars: Large,
- Mom: fast.
WSFG Weekly
- Short-Term
- WSFG Current: NA%
- F0%/NTZ' Bias: Price Neutral,
- WSFG Trend: Neutral.
MSFG Month Jul
- Intermediate-Term
- MSFG Current: NA%
- F0%/NTZ' Bias: Price Neutral,
- MSFG Trend: Neutral.
YSFG Year 2026
- Long-Term
- YSFG Current: NA%
- F0%/NTZ' Bias: Price Neutral,
- YSFG Trend: Neutral.
Swing Pivots
- (Short-Term) 1. Pvt. Trend: UTrend,
- (Intermediate-Term) 2. HiLo Trend: DTrend,
- 3. Pvt. Evolve: Pvt High 115.00,
- 4. Pvt. Next: Pvt Low 109.58,
- 5. Levels R: 154.08, 141.42, 115.00,
- 6. Levels S: 102.42, 98.47, 89.11, 78.03, 75.18.
Daily Benchmarks
- (Short-Term) 5 Day: 105.39 Up Trend,
- (Short-Term) 10 Day: 106.64 Up Trend,
- (Intermediate-Term) 20 Day: 114.89 Down Trend,
- (Intermediate-Term) 55 Day: 121.06 Down Trend,
- (Long-Term) 100 Day: 119.59 Down Trend,
- (Long-Term) 200 Day: 95.70 Up Trend.
Additional Metrics
- ATR: 5.00,
- VOLMA: 2577640.
Overall Rating
- Short-Term: Bearish,
- Intermediate-Term: Bearish,
- Long-Term: Neutral.
Key Insights Summary
USO is in a large daily swing phase after a sharp decline from the June peak, with the latest bar rebounding into the 115 area but still below the 20, 55, and 100 day benchmarks. Short-term structure remains mixed-to-bearish despite the current pivot trend turning up, while the intermediate HiLo structure is still in a downtrend and the pivot sequence is working through a lower-high / lower-low cycle. The price is sitting near a major pivot cluster around 115, with overhead resistance defined by 141.42 and 154.08 and broader support layered down through 102.42, 98.47, 89.11, 78.03, and 75.18. The 200 day remains well below price and is still rising, keeping the longer horizon from being fully bearish even as the medium-term trend has rolled over. The chart shows a volatile trend reversal and retracement sequence, with a fast momentum rebound coming off a selloff, but the broader pattern still reflects a corrective swing within a larger range.
Chart Analysis ATS AI Generated: 2026-07-09 07:08 for Informational use only, not trading advice. Terms and Risk Disclosure Copyright © 2026. Algo Trading Systems LLC.