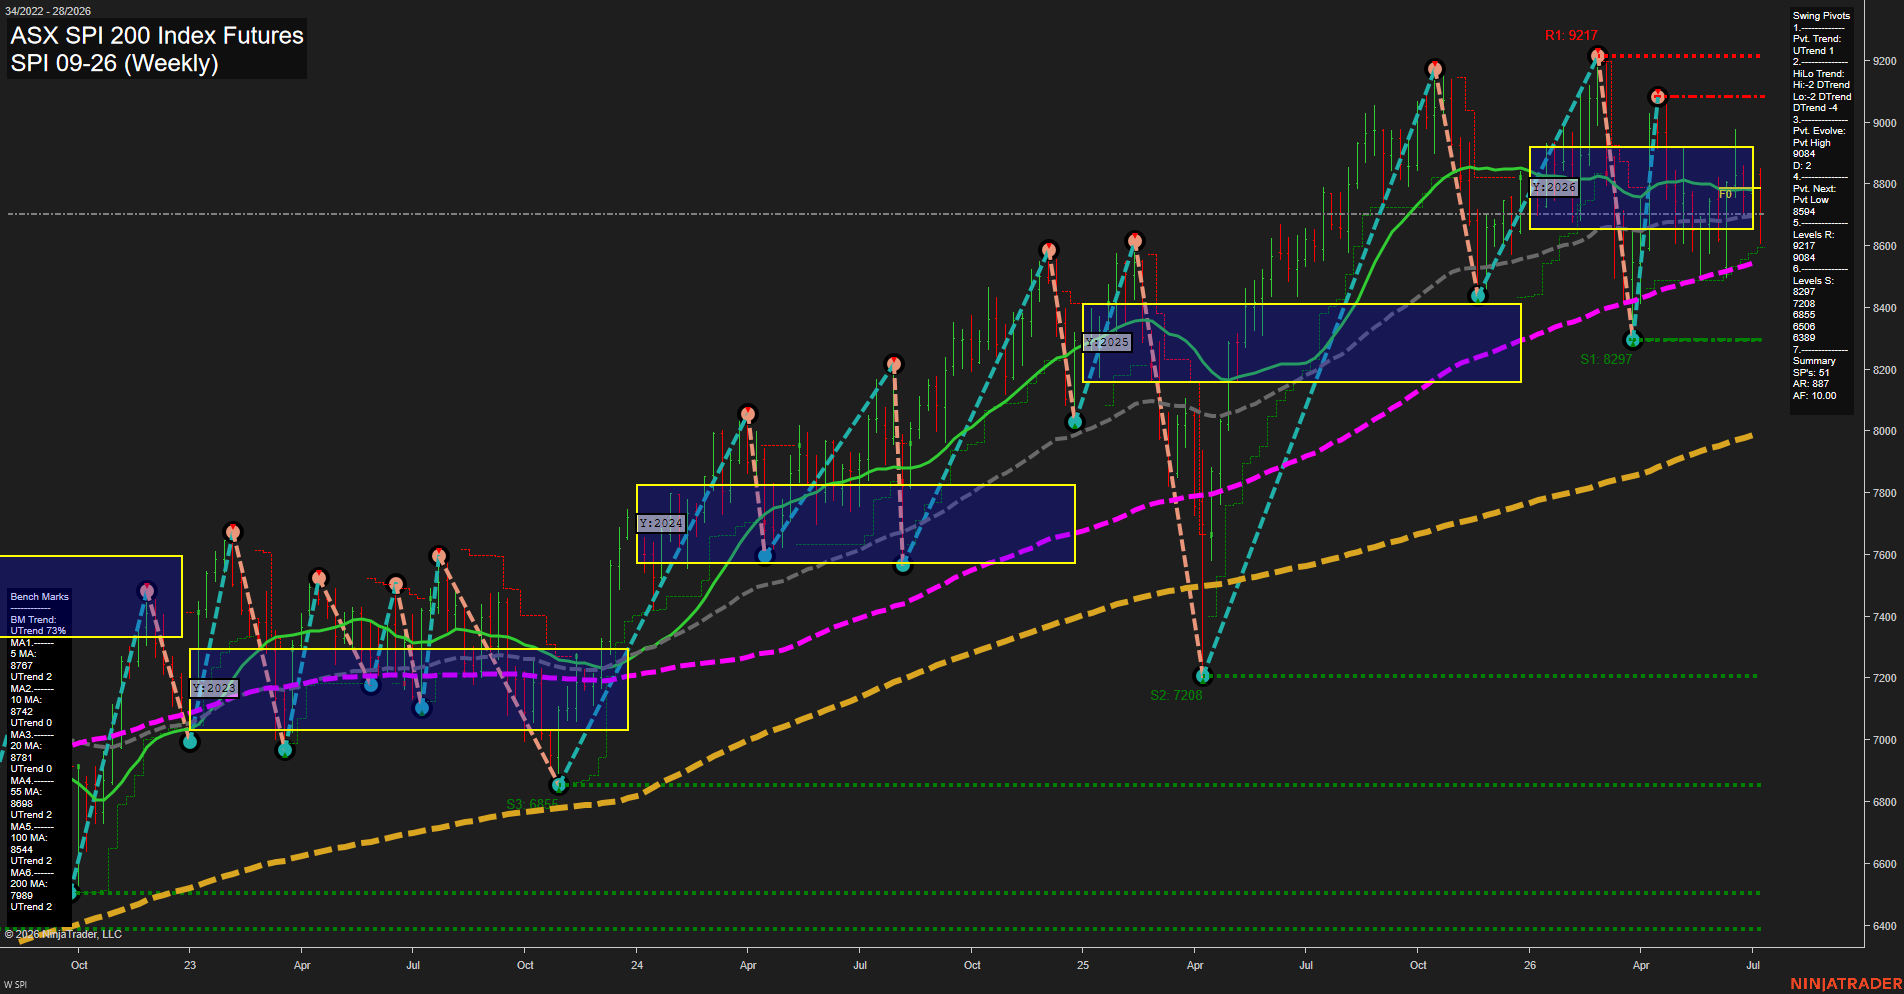
SPI ASX SPI 200 Index Futures Weekly Chart Analysis: 2026-Jul-09 07:07 CT
Price Action
- Last: 8770,
- Bars: Medium,
- Mom: average.
WSFG Weekly
- Short-Term
- WSFG Current: NA%
- F0%/NTZ' Bias: Price Neutral,
- WSFG Trend: Neutral.
MSFG Month Jul
- Intermediate-Term
- MSFG Current: NA%
- F0%/NTZ' Bias: Price Neutral,
- MSFG Trend: Neutral.
YSFG Year 2026
- Long-Term
- YSFG Current: NA%
- F0%/NTZ' Bias: Price Neutral,
- YSFG Trend: Neutral.
Swing Pivots
- (Short-Term) 1. Pvt. Trend: UTrend,
- (Intermediate-Term) 2. HiLo Trend: DTrend,
- 3. Pvt. Evolve: Pvt High 9084,
- 4. Pvt. Next: Pvt Low 8594,
- 5. Levels R: 9217, 9084,
- 6. Levels S: 8297, 7208, 6855, 6506, 6389.
Weekly Benchmarks
- (Short-Term) 5 Day: 8767 Up Trend,
- (Short-Term) 10 Day: 8742 Up Trend,
- (Intermediate-Term) 20 Day: 8781 Up Trend,
- (Intermediate-Term) 55 Day: 8698 Up Trend,
- (Long-Term) 100 Day: 8544 Up Trend,
- (Long-Term) 200 Day: 7888 Up Trend.
Overall Rating
- Short-Term: Neutral,
- Intermediate-Term: Bullish,
- Long-Term: Bullish.
Key Insights Summary
The weekly structure remains constructive over the larger cycle, with price holding well above the rising 55-day, 100-day, and 200-day benchmarks, which keeps the dominant trend aligned to the upside. Short-term action is more mixed: price is sitting inside the 2026 NTZ zone and near the center of the current yearly fib box, which reflects balance rather than expansion. The pivot structure shows a short-term UTrend, but the intermediate hi/lo framework is still marked by a DTrend, indicating a market that has recently retraced from elevated highs and is working through a corrective phase. Resistance is concentrated at 9084 and 9217, while support layers are stacked at 8297, 7208, and lower historical levels, showing a broad multi-swing advance with recurring pullbacks and recoveries. Overall, the chart reads as a higher-timeframe uptrend that is consolidating beneath prior highs, with momentum measured rather than impulsive and weekly price action still digesting the latest swing down from 9084.
Chart Analysis ATS AI Generated: 2026-07-09 07:08 for Informational use only, not trading advice. Terms and Risk Disclosure Copyright © 2026. Algo Trading Systems LLC.