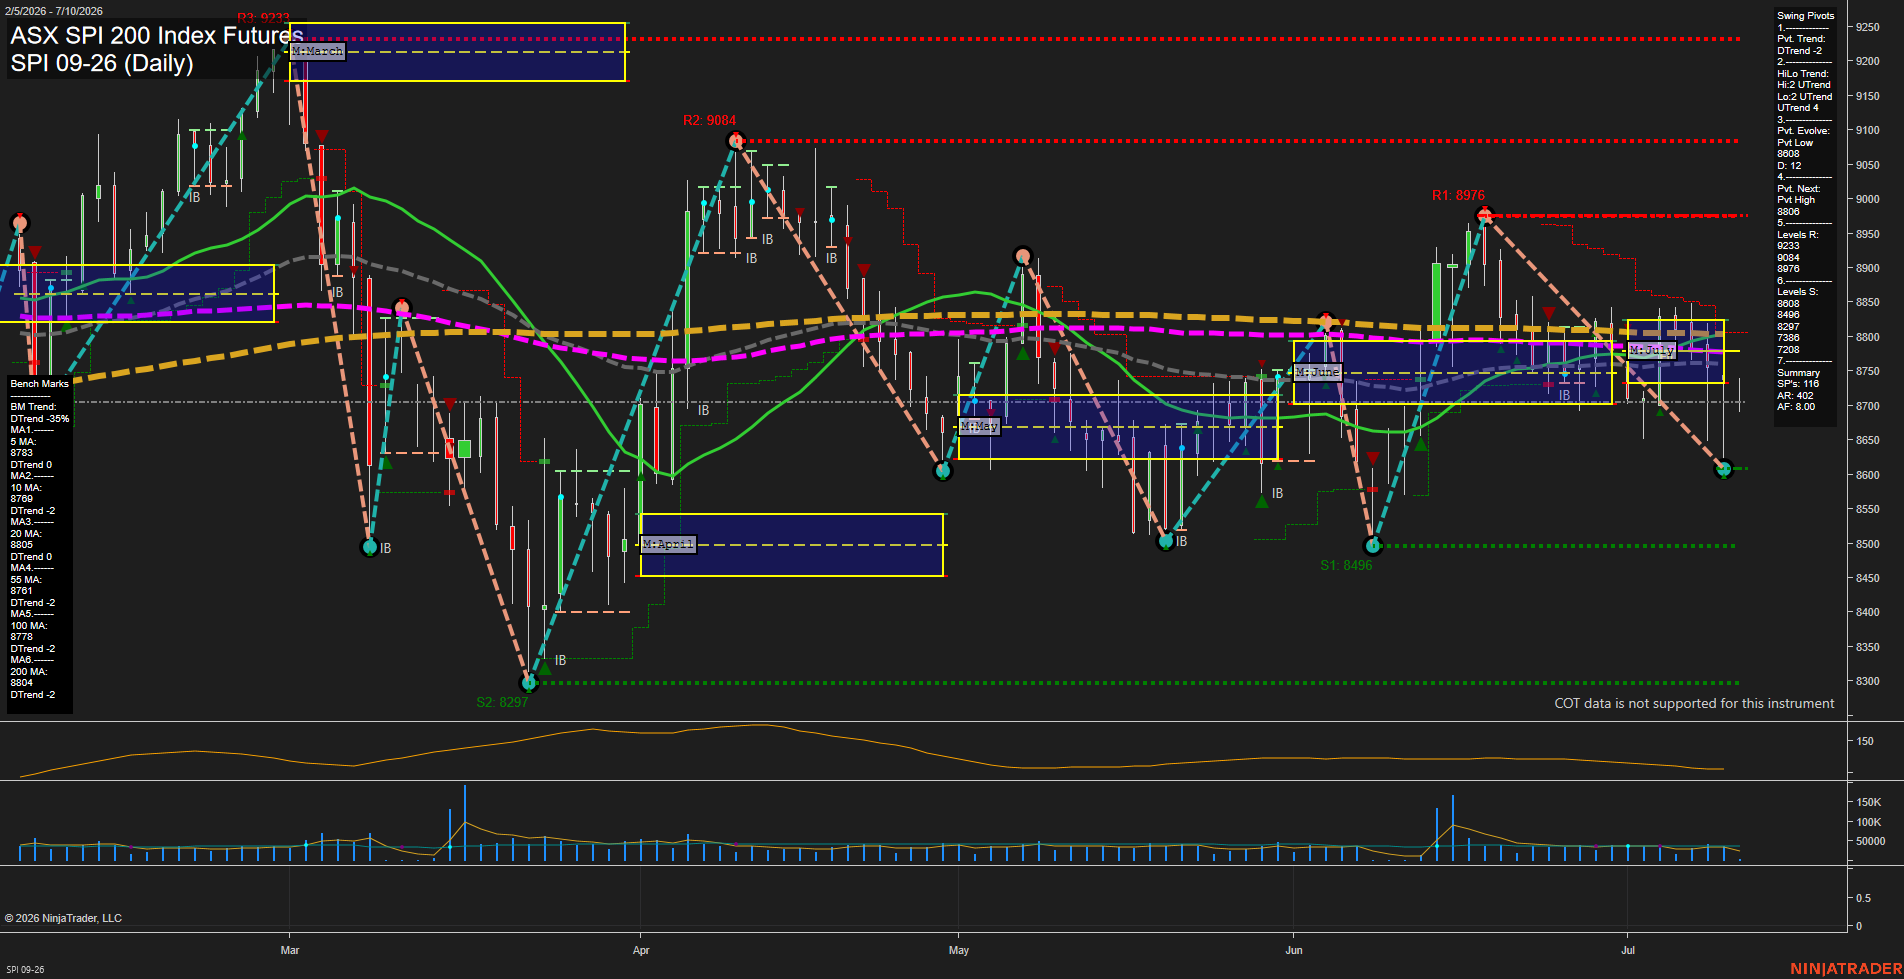
SPI ASX SPI 200 Index Futures Daily Chart Analysis: 2026-Jul-09 07:07 CT
Price Action
- Last: 8770,
- Bars: Large,
- Mom: average.
WSFG Weekly
- Short-Term
- WSFG Current: NA%
- F0%/NTZ' Bias: Price Neutral,
- WSFG Trend: Neutral.
MSFG Month Jul
- Intermediate-Term
- MSFG Current: NA%
- F0%/NTZ' Bias: Price Neutral,
- MSFG Trend: Neutral.
YSFG Year 2026
- Long-Term
- YSFG Current: NA%
- F0%/NTZ' Bias: Price Neutral,
- YSFG Trend: Neutral.
Swing Pivots
- (Short-Term) 1. Pvt. Trend: DTrend,
- (Intermediate-Term) 2. HiLo Trend: UTrend,
- 3. Pvt. Evolve: Pvt Low 8608,
- 4. Pvt. Next: Pvt High 8806,
- 5. Levels R: 9233, 9084, 8976,
- 6. Levels S: 8608, 8496, 8297, 7388, 7208.
Daily Benchmarks
- (Short-Term) 5 Day: 8783 Down Trend,
- (Short-Term) 10 Day: 8769 Down Trend,
- (Intermediate-Term) 20 Day: 8805 Down Trend,
- (Intermediate-Term) 55 Day: 8761 Down Trend,
- (Long-Term) 100 Day: 8778 Down Trend,
- (Long-Term) 200 Day: 8804 Down Trend.
Additional Metrics
Overall Rating
- Short-Term: Bearish,
- Intermediate-Term: Neutral,
- Long-Term: Bearish.
Key Insights Summary
Price is holding in a broad mid-range after the prior June rebound and the latest push back from the 8976/9084 resistance zone. The short-term pivot structure remains in a DTrend, while the intermediate HiLo structure stays constructive, reflecting a market that is still oscillating rather than trending cleanly. Daily benchmarks are clustered tightly around the current price, showing a compressed, two-way tape with no strong moving-average separation. The current location near the 55-day area and below the 20-day/100-day cluster keeps the daily tone mixed to slightly defensive, while the larger swing map still shows overhead supply at 8976, 9084, and 9233 and layered support at 8608, 8496, and 8297. Overall, the chart reads as a choppy consolidation with a mild bearish short-term lean, neutral intermediate balance, and a heavier long-term ceiling.
Chart Analysis ATS AI Generated: 2026-07-09 07:07 for Informational use only, not trading advice. Terms and Risk Disclosure Copyright © 2026. Algo Trading Systems LLC.