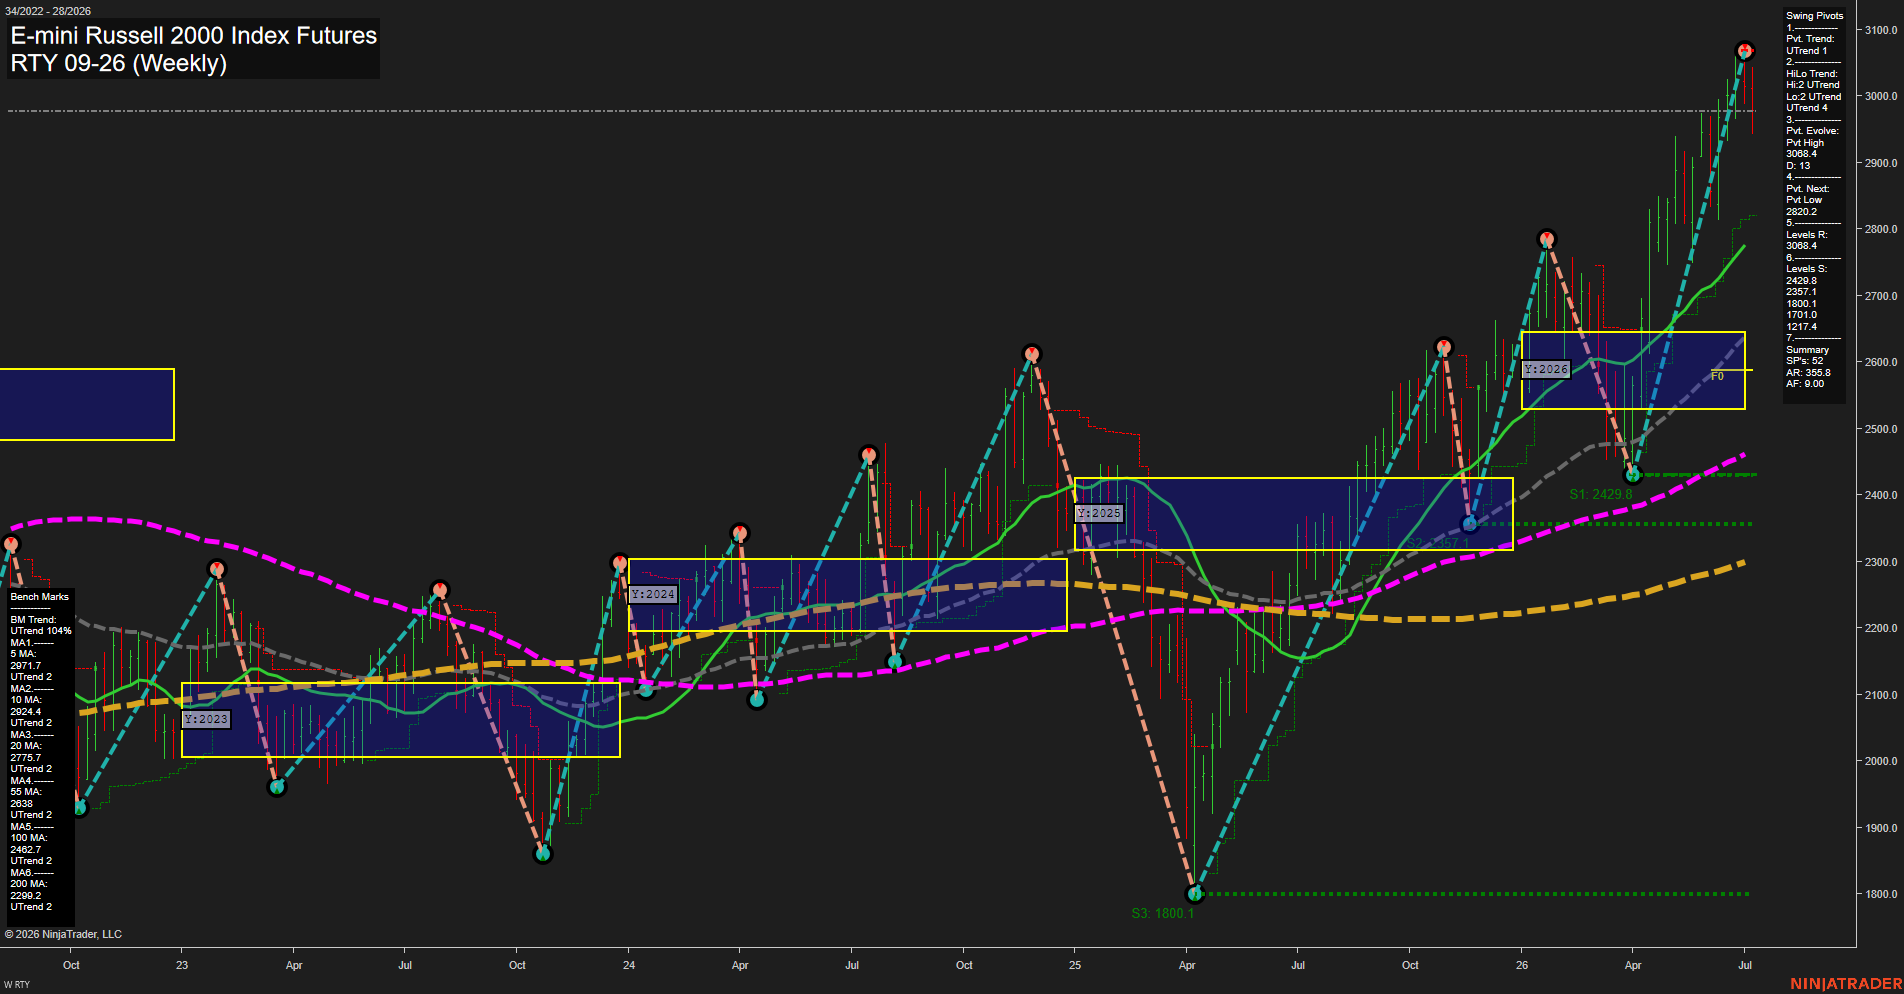
RTY E-mini Russell 2000 Index Futures Weekly Chart Analysis: 2026-Jul-09 07:07 CT
Price Action
- Last: 2983.1,
- Bars: Large,
- Mom: fast.
WSFG Weekly
- Short-Term
- WSFG Current: -37%
- F0%/NTZ' Bias: Price Below,
- WSFG Trend: Down.
MSFG Month Jul
- Intermediate-Term
- MSFG Current: -22%
- F0%/NTZ' Bias: Price Below,
- MSFG Trend: Down.
YSFG Year 2026
- Long-Term
- YSFG Current: 68%
- F0%/NTZ' Bias: Price Above,
- YSFG Trend: Up.
Swing Pivots
- (Short-Term) 1. Pvt. Trend: UTrend,
- (Intermediate-Term) 2. HiLo Trend: UTrend,
- 3. Pvt. Evolve: Pvt High 3088.4,
- 4. Pvt. Next: Pvt Low 2820.2,
- 5. Levels R: 3088.4,
- 6. Levels S: 2429.8, 2357.1, 1800.1, 1701.0, 1217.4.
Weekly Benchmarks
- (Short-Term) 5 Day: 2971.7 Up Trend,
- (Short-Term) 10 Day: 2924.4 Up Trend,
- (Intermediate-Term) 20 Day: 2775.7 Up Trend,
- (Intermediate-Term) 55 Day: 2638.0 Up Trend,
- (Long-Term) 100 Day: 2462.7 Up Trend,
- (Long-Term) 200 Day: 2289.2 Up Trend.
Recent Trade Signals
- 09 Jul 2026: Short RTY 09-26 @ 2983.1 Signals.USAR-MSFG
- 07 Jul 2026: Short RTY 09-26 @ 3007.4 Signals.USAR-WSFG
- 02 Jul 2026: Short RTY 09-26 @ 2991.2 Signals.USAR.TR120
Overall Rating
- Short-Term: Bearish,
- Intermediate-Term: Neutral,
- Long-Term: Bullish.
Key Insights Summary
RTY is pressing into the upper end of a powerful multi-year advance, with the 2026 yearly fib structure still firmly bullish and price holding well above the major moving-average stack. The weekly and monthly session fib grids remain below their F0% levels, which keeps the short and intermediate rhythm softer even while the broader trend is constructive. Swing structure shows a confirmed higher-high / higher-low profile, with the most recent pivot high at 3088.4 and the next downside pivot reference at 2820.2, framing the current market as a strong uptrend that has recently become stretched after a sharp run. The latest weekly action reflects a fast, large-bar advance into resistance, followed by a pullback from the peak, which fits a rally-extension and consolidation setup rather than a fresh breakout week. The trade signal sequence shows repeated short-side triggers on the weekly and monthly fib frameworks, reinforcing near-term weakness against the longer-term bullish trend backdrop.
Chart Analysis ATS AI Generated: 2026-07-09 07:07 for Informational use only, not trading advice. Terms and Risk Disclosure Copyright © 2026. Algo Trading Systems LLC.