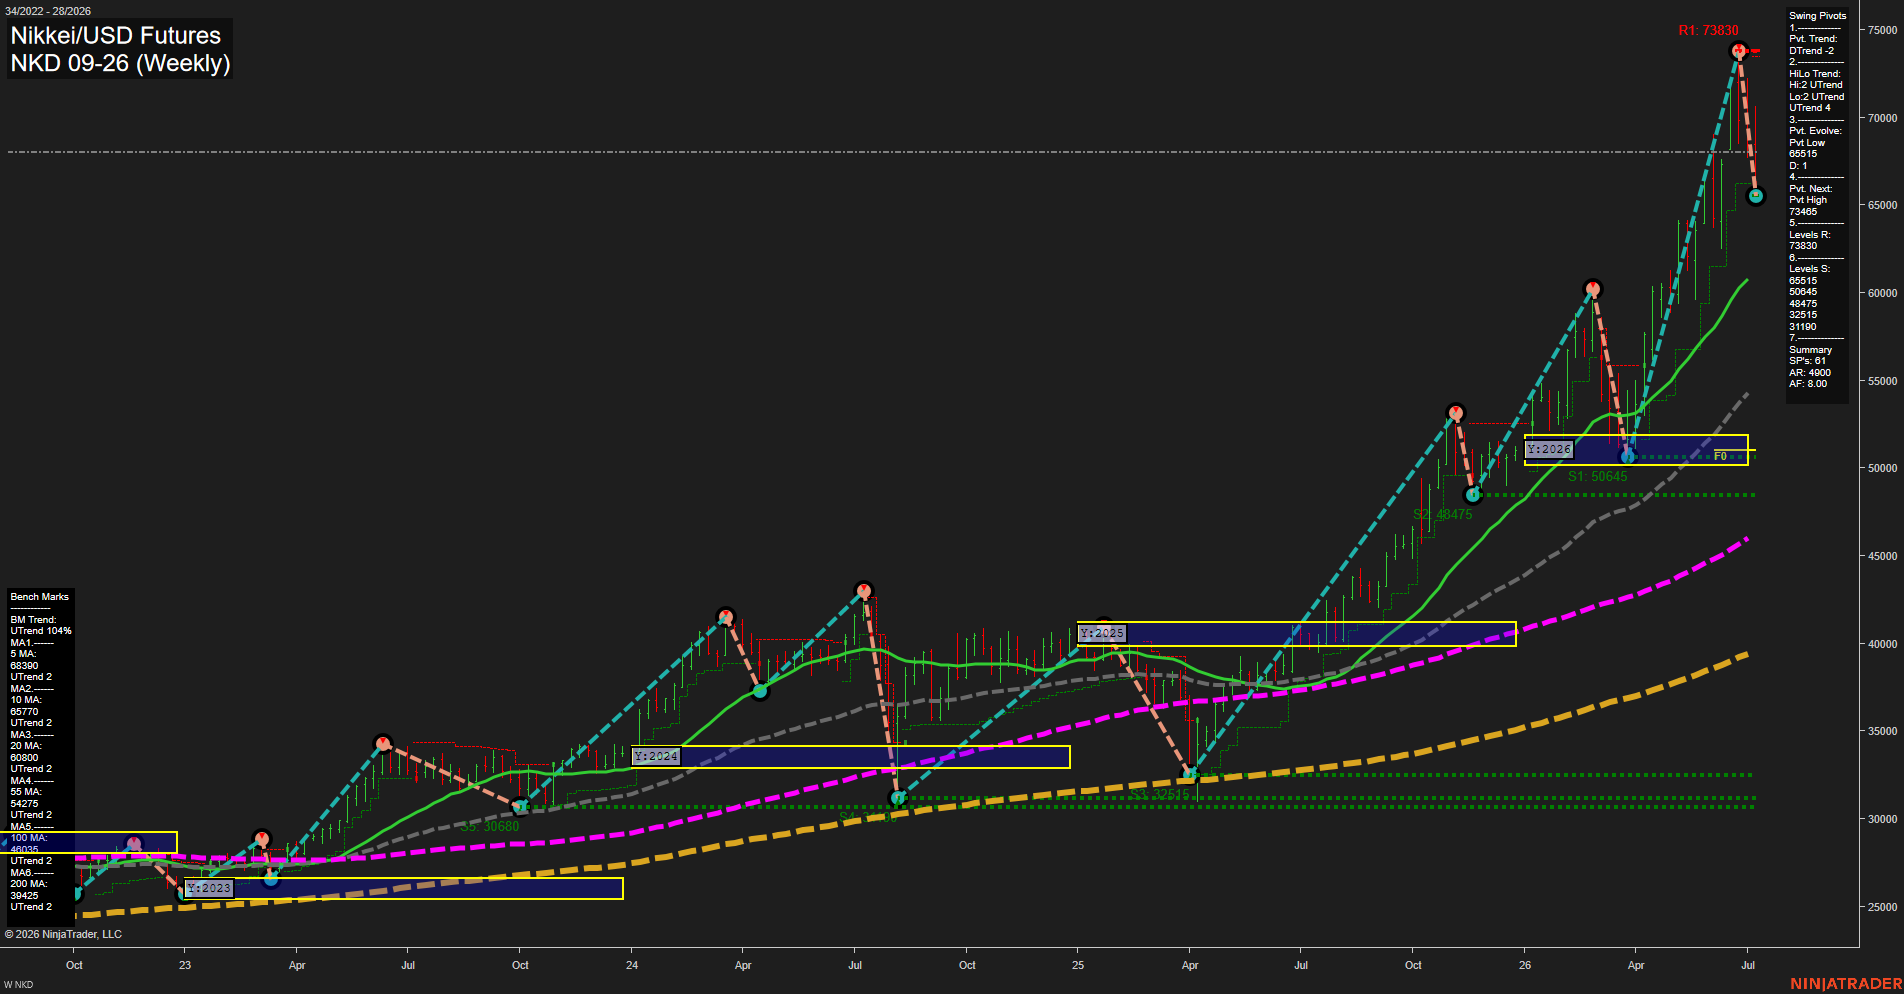
NKD Nikkei/USD Futures Weekly Chart Analysis: 2026-Jul-09 07:05 CT
Price Action
- Last: 65615,
- Bars: Large,
- Mom: fast.
WSFG Weekly
- Short-Term
- WSFG Current: -39%
- F0%/NTZ' Bias: Price Below,
- WSFG Trend: Down.
MSFG Month Jul
- Intermediate-Term
- MSFG Current: -34%
- F0%/NTZ' Bias: Price Below,
- MSFG Trend: Down.
YSFG Year 2026
- Long-Term
- YSFG Current: 203%
- F0%/NTZ' Bias: Price Above,
- YSFG Trend: Up.
Swing Pivots
- (Short-Term) 1. Pvt. Trend: DTrend,
- (Intermediate-Term) 2. HiLo Trend: UTrend,
- 3. Pvt. Evolve: Pvt low 65515,
- 4. Pvt. Next: Pvt high 73485,
- 5. Levels R: 73830,
- 6. Levels S: 65515, 50845, 48475, 32515, 31190.
Weekly Benchmarks
- (Short-Term) 5 Day: 68390 Down Trend,
- (Short-Term) 10 Day: 65770 Down Trend,
- (Intermediate-Term) 20 Day: 60800 Up Trend,
- (Intermediate-Term) 55 Day: 54275 Up Trend,
- (Long-Term) 100 Day: 46035 Up Trend,
- (Long-Term) 200 Day: 39425 Up Trend.
Recent Trade Signals
- 07 Jul 2026: Short NKD 09-26 @ 68725 Signals.USAR.TR120
- 07 Jul 2026: Short NKD 09-26 @ 69415 Signals.USAR-WSFG
- 03 Jul 2026: Short NKD 09-26 @ 69875 Signals.USAR-MSFG
Overall Rating
- Short-Term: Bearish,
- Intermediate-Term: Bearish,
- Long-Term: Bullish.
Key Insights Summary
Weekly price has reversed sharply from the 73,830 resistance zone back into the 65,515 support area, leaving the short-term structure in a DTrend with fast downside momentum and multiple fresh short signals aligned across the weekly and monthly session grids. The monthly and weekly fib positions are both below their F0% centers, confirming a corrective-to-bearish swing tone on the near and intermediate horizons, while the yearly grid remains strongly positive and still reflects a dominant long-term uptrend. Benchmarks show the faster moving averages rolling over beneath price, even though the higher-period averages remain firmly stacked in bullish order, which keeps the broader trend constructive despite the current pullback. The pivot map shows a completed lower swing high sequence into a pivot low at 65,515, with overhead resistance at 73,830 and layered support beneath at 50,845, 48,475, 32,515, and 31,190. Overall, the chart is in a high-volatility retracement phase inside a larger secular advance, with countertrend pressure dominating the weekly swing and the long-term trend still pointing higher.
Chart Analysis ATS AI Generated: 2026-07-09 07:05 for Informational use only, not trading advice. Terms and Risk Disclosure Copyright © 2026. Algo Trading Systems LLC.