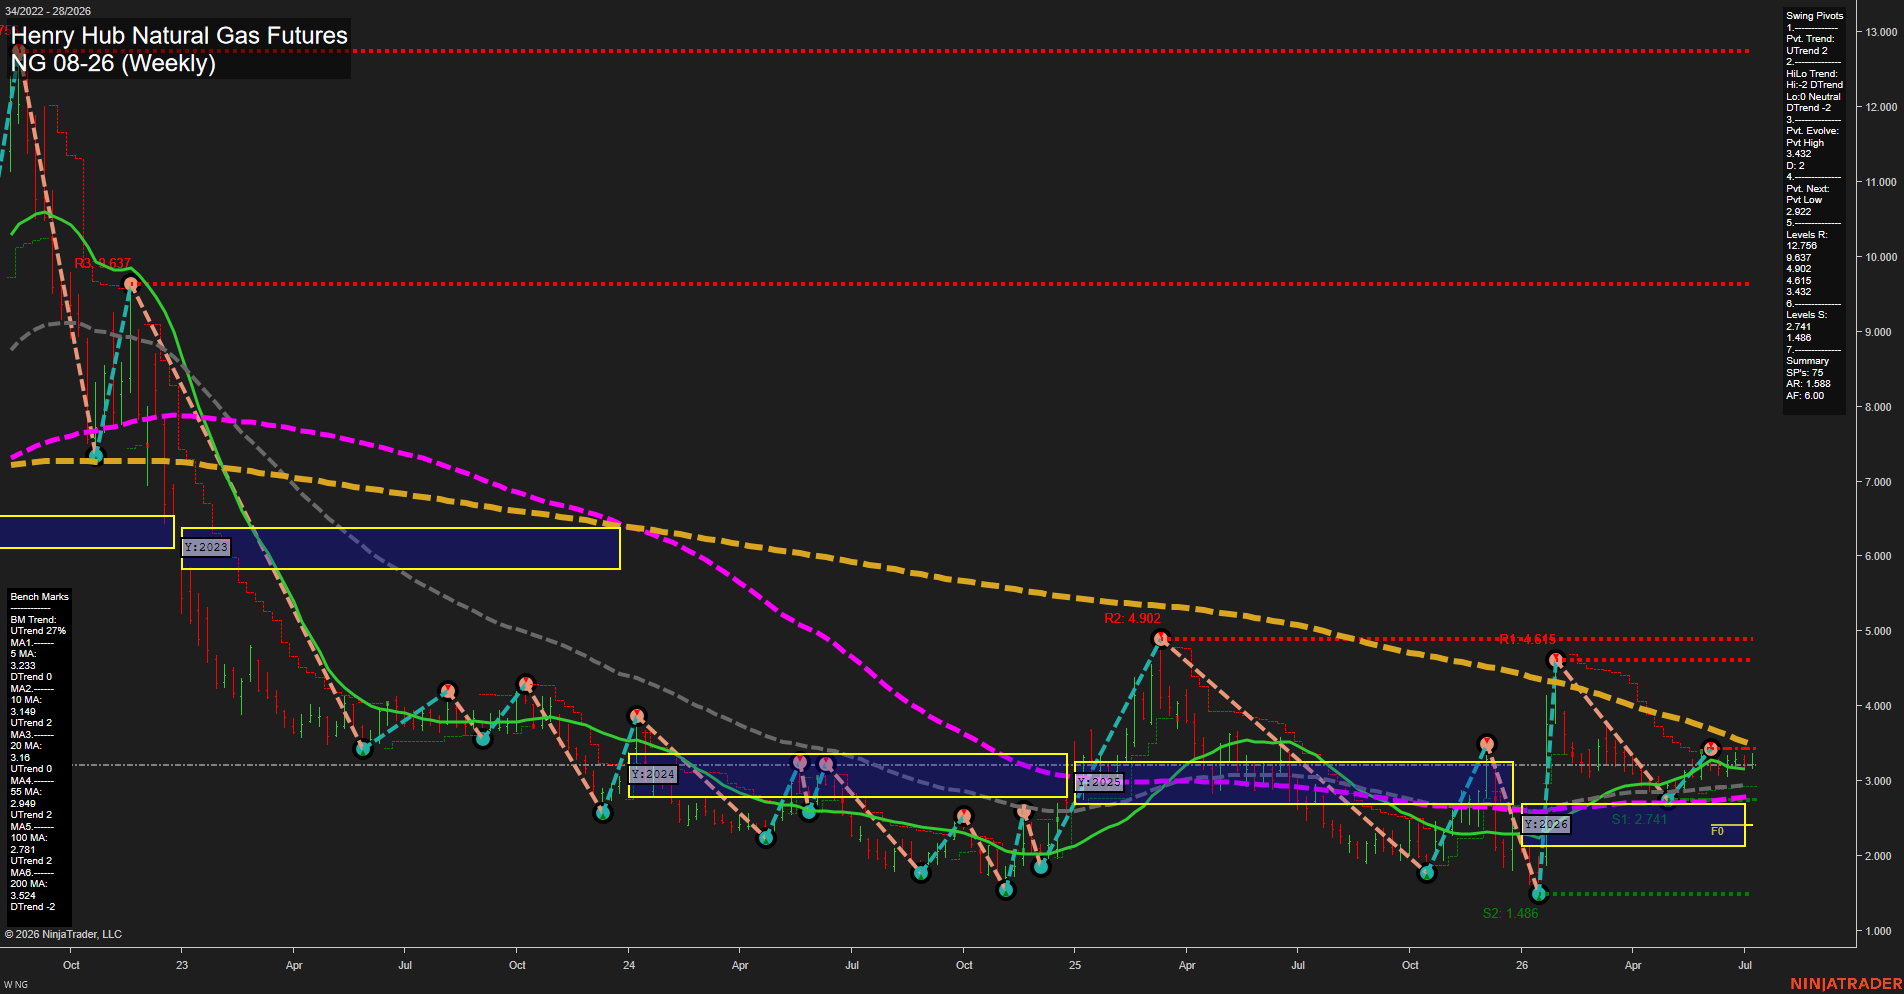
NG Henry Hub Natural Gas Futures Weekly Chart Analysis: 2026-Jul-09 07:05 CT
Price Action
- Last: 3.203,
- Bars: Medium,
- Mom: Slow.
WSFG Weekly
- Short-Term
- WSFG Current: 3%
- F0%/NTZ' Bias: Price Above,
- WSFG Trend: Up.
MSFG Month Jul
- Intermediate-Term
- MSFG Current: -9%
- F0%/NTZ' Bias: Price Below,
- MSFG Trend: Down.
YSFG Year 2026
- Long-Term
- YSFG Current: 28%
- F0%/NTZ' Bias: Price Above,
- YSFG Trend: Up.
Swing Pivots
- (Short-Term) 1. Pvt. Trend: UTrend,
- (Intermediate-Term) 2. HiLo Trend: DTrend,
- 3. Pvt. Evolve: Pvt High 3.432,
- 4. Pvt. Next: Pvt Low 2.922,
- 5. Levels R: 12.758, 9.637, 4.902, 4.615, 3.432,
- 6. Levels S: 2.741, 1.486.
Weekly Benchmarks
- (Short-Term) 5 Day: 3.233 Down Trend,
- (Short-Term) 10 Day: 3.149 Up Trend,
- (Intermediate-Term) 20 Day: 3.160 Up Trend,
- (Intermediate-Term) 55 Day: 2.949 Up Trend,
- (Long-Term) 100 Day: 2.781 Up Trend,
- (Long-Term) 200 Day: 3.524 Down Trend.
Recent Trade Signals
- 09 Jul 2026: Short NG 08-26 @ 3.203 Signals.USAR-MSFG
- 07 Jul 2026: Long NG 08-26 @ 3.272 Signals.USAR.TR120
Overall Rating
- Short-Term: Neutral,
- Intermediate-Term: Bearish,
- Long-Term: Bullish.
Key Insights Summary
Natural gas is trading near the 3.20 area after a large multiyear decline, with the weekly structure showing a compact recovery phase rather than a clean directional breakout. The short-term WSFG remains positive and the current pivot trend is UTrend, but price is still working through nearby overhead pivot resistance around 3.432 and 4.615, which keeps the weekly tone more rotational than impulsive. The July monthly grid remains below F0%, and the intermediate pivot HiLo trend is DTrend, matching the fresh short signal and the broader month-to-date weakness. By contrast, the 2026 yearly grid still holds above F0% with a positive long-term bias, reflecting that the larger yearly cycle has improved from the deep winter washout and is now rebuilding above the lower NTZ band. The benchmark stack is mixed but constructive beneath price, with 10, 20, 55, and 100 day measures aligned upward while the 200 day remains downward, creating a transition zone rather than a fully confirmed trend regime. Overall, the chart reads as a volatile swing market with a short-term bounce inside a still-corrective intermediate structure and a longer-term yearly recovery base.
Chart Analysis ATS AI Generated: 2026-07-09 07:05 for Informational use only, not trading advice. Terms and Risk Disclosure Copyright © 2026. Algo Trading Systems LLC.