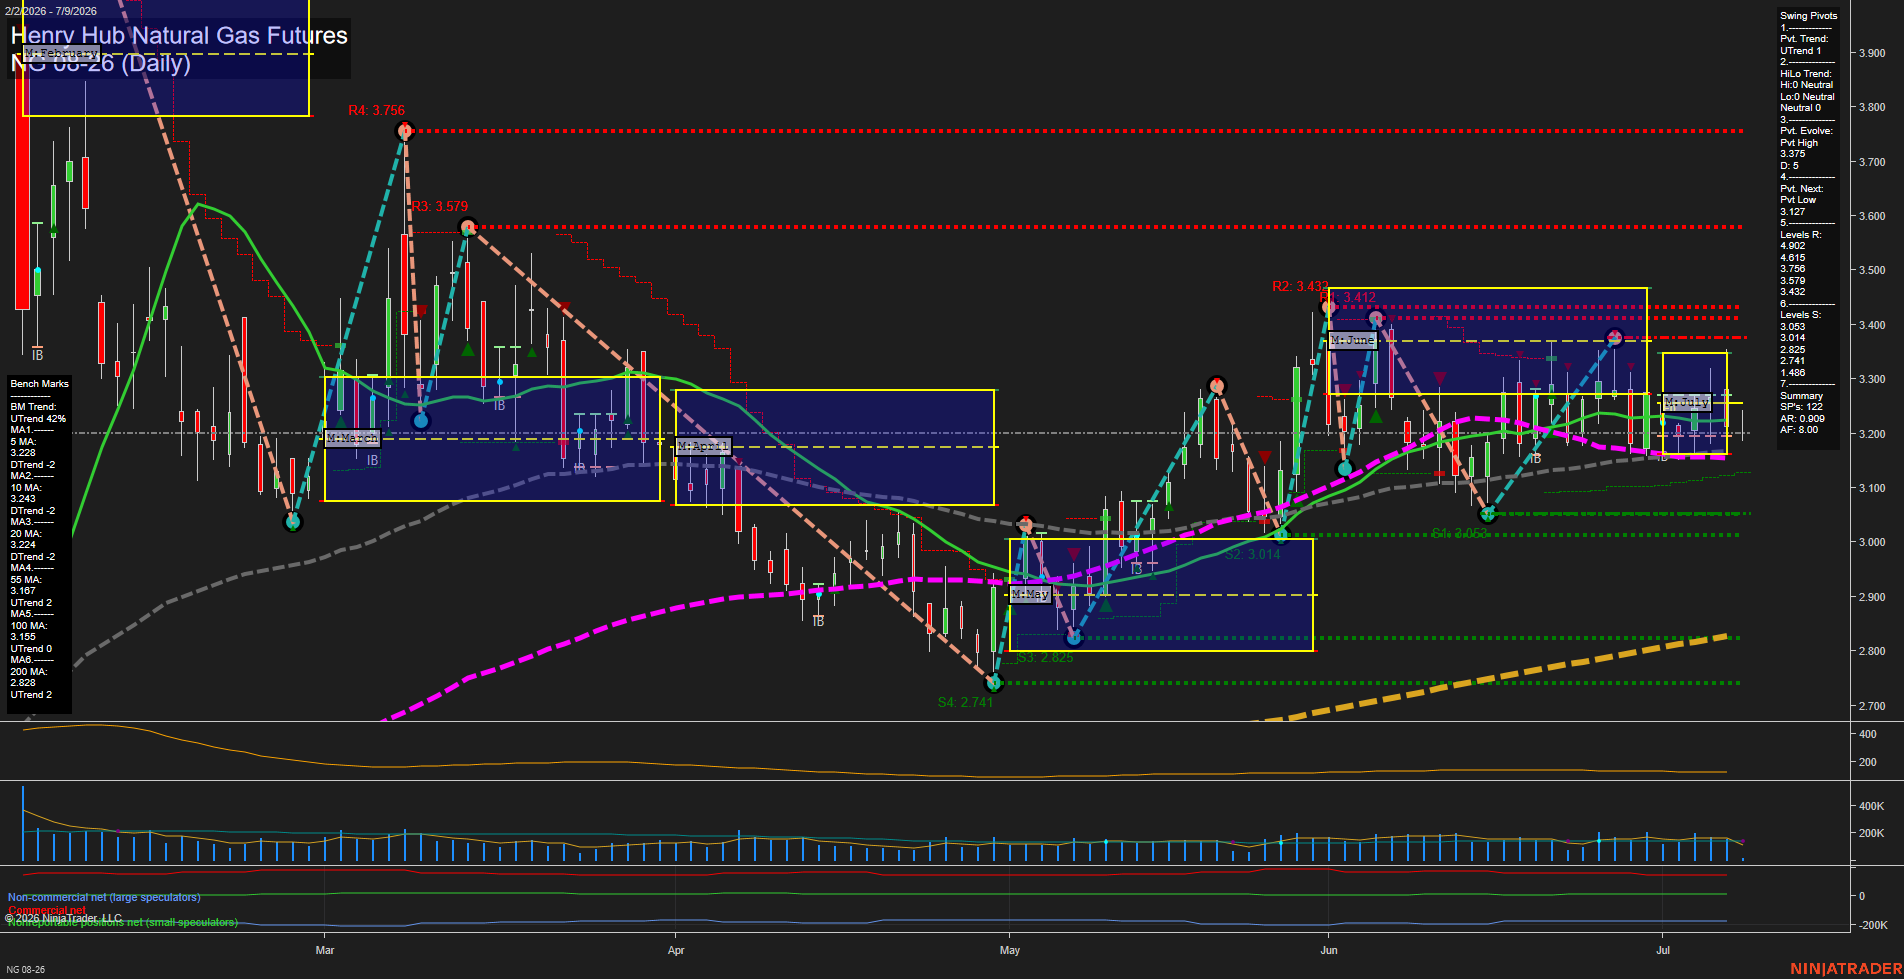
NG Henry Hub Natural Gas Futures Daily Chart Analysis: 2026-Jul-09 07:05 CT
Price Action
- Last: 3.222,
- Bars: Medium,
- Mom: average.
WSFG Weekly
- Short-Term
- WSFG Current: 3%
- F0%/NTZ' Bias: Price Above,
- WSFG Trend: Up.
MSFG Month Jul
- Intermediate-Term
- MSFG Current: -9%
- F0%/NTZ' Bias: Price Below,
- MSFG Trend: Down.
YSFG Year 2026
- Long-Term
- YSFG Current: 28%
- F0%/NTZ' Bias: Price Above,
- YSFG Trend: Up.
Swing Pivots
- (Short-Term) 1. Pvt. Trend: UTrend,
- (Intermediate-Term) 2. HiLo Trend: Neutral,
- 3. Pvt. Evolve: Pvt High 3.375,
- 4. Pvt. Next: Pvt Low 3.127,
- 5. Levels R: 4.902, 4.615, 3.756, 3.579, 3.432,
- 6. Levels S: 3.053, 3.014, 2.825, 2.741, 1.486.
Daily Benchmarks
- (Short-Term) 5 Day: 3.228 Down Trend,
- (Short-Term) 10 Day: 3.243 Down Trend,
- (Intermediate-Term) 20 Day: 3.224 Down Trend,
- (Intermediate-Term) 55 Day: 3.167 Up Trend,
- (Long-Term) 100 Day: 3.155 Up Trend,
- (Long-Term) 200 Day: 2.828 Up Trend.
Additional Metrics
- ATR: 0.909,
- VOLMA: 80000.
Recent Trade Signals
- 09 Jul 2026: Short NG 08-26 @ 3.203 Signals.USAR-MSFG
- 07 Jul 2026: Long NG 08-26 @ 3.272 Signals.USAR.TR120
Overall Rating
- Short-Term: Bullish,
- Intermediate-Term: Neutral,
- Long-Term: Bullish.
Key Insights Summary
Natural gas is holding a constructive swing structure above the weekly fib bias and above the long-term benchmark stack, while the monthly session fib remains below F0% and continues to frame the intermediate backdrop as corrective. Price is trading near the 3.22 area, with short-term moving averages still sloping lower, but the daily pivot structure remains in an uptrend and the market is working above the 55-, 100-, and 200-day benchmarks. The chart shows a broader recovery from the early-May low into a June advance, followed by a July consolidation around the 3.20 to 3.30 zone, with nearby pivot resistance clustered at 3.432 and 3.579 and support layered at 3.053, 3.014, and 2.825. That mix leaves the tape in a choppy but still upward-leaning swing phase, with longer-term trend support intact even as the monthly fib grid and faster averages remain in a corrective posture.
Chart Analysis ATS AI Generated: 2026-07-09 07:05 for Informational use only, not trading advice. Terms and Risk Disclosure Copyright © 2026. Algo Trading Systems LLC.