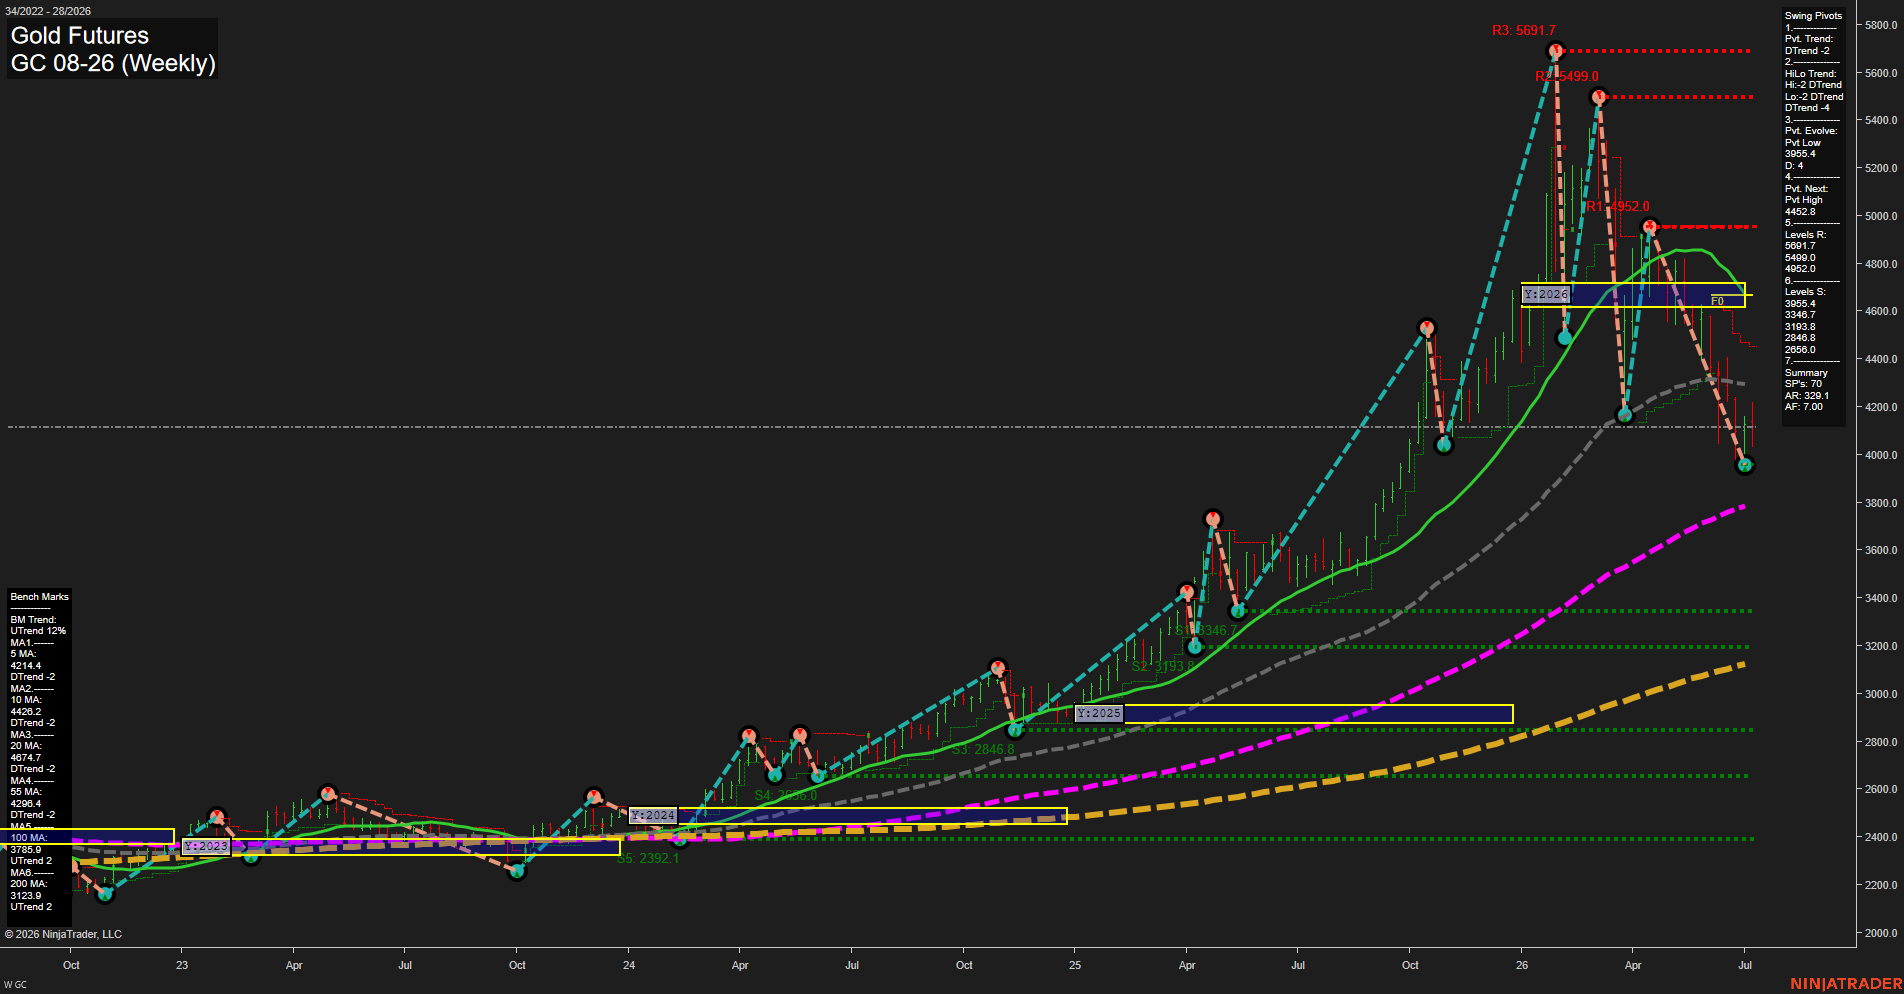
GC Gold Futures Weekly Chart Analysis: 2026-Jul-09 07:04 CT
Price Action
- Last: 4067.0,
- Bars: Large,
- Mom: Fast.
WSFG Weekly
- Short-Term
- WSFG Current: -25%
- F0%/NTZ' Bias: Price Below,
- WSFG Trend: Down.
MSFG Month Jul
- Intermediate-Term
- MSFG Current: 20%
- F0%/NTZ' Bias: Price Above,
- MSFG Trend: Up.
YSFG Year 2026
- Long-Term
- YSFG Current: -107%
- F0%/NTZ' Bias: Price Below,
- YSFG Trend: Down.
Swing Pivots
- (Short-Term) 1. Pvt. Trend: DTrend,
- (Intermediate-Term) 2. HiLo Trend: DTrend,
- 3. Pvt. Evolve: Pvt Low 3955.4,
- 4. Pvt. Next: Pvt High 4452.8,
- 5. Levels R: 5691.7, 5499.0, 4952.0,
- 6. Levels S: 3955.4, 3346.7, 3193.8, 2846.8, 2656.0, 2392.1.
Weekly Benchmarks
- (Short-Term) 5 Day: 4214.4 Down Trend,
- (Short-Term) 10 Day: 4426.2 Down Trend,
- (Intermediate-Term) 20 Day: 4674.7 Down Trend,
- (Intermediate-Term) 55 Day: 4298.4 Down Trend,
- (Long-Term) 100 Day: 3785.9 Up Trend,
- (Long-Term) 200 Day: 3123.9 Up Trend.
Recent Trade Signals
- 08 Jul 2026: Short GC 08-26 @ 4134.4 Signals.USAR-WSFG
- 07 Jul 2026: Long GC 08-26 @ 4135.4 Signals.USAR-MSFG
- 01 Jul 2026: Long GC 08-26 @ 4095.5 Signals.USAR.TR120
Overall Rating
- Short-Term: Bearish,
- Intermediate-Term: Bearish,
- Long-Term: Neutral.
Key Insights Summary
Gold remains in a sharp weekly pullback after a powerful multi-year rally, with the latest candle showing large-range downside momentum and price slipping back below the weekly session fib equilibrium. Short-term structure is aligned bearish through the WSFG, down pivot trend, and the fresh short signal, while the monthly session fib still shows an intermediate up bias that reflects the broader higher-timeframe uptrend that preceded this retracement. The yearly session fib is still negative for 2026 and the current price is trading beneath the key swing pivot resistance band, leaving the chart in a corrective phase with support defined by 3955.4 first, then the lower pivot shelves beneath it. Long-term moving averages remain rising and price is still above the 100 and 200 day benchmarks, but the near-term structure is dominated by rejection from the upper pivot zone and a retreat toward prior support.
Chart Analysis ATS AI Generated: 2026-07-09 07:04 for Informational use only, not trading advice. Terms and Risk Disclosure Copyright © 2026. Algo Trading Systems LLC.