GC Gold Futures Daily Chart Analysis: 2026-Jul-09 07:04 CT
Price Action
- Last: 4091.8,
- Bars: Medium,
- Mom: fast.
WSFG Weekly
- Short-Term
- WSFG Current: -25%
- F0%/NTZ' Bias: Price Below,
- WSFG Trend: Down.
MSFG Month Jul
- Intermediate-Term
- MSFG Current: 20%
- F0%/NTZ' Bias: Price Above,
- MSFG Trend: Up.
YSFG Year 2026
- Long-Term
- YSFG Current: -107%
- F0%/NTZ' Bias: Price Below,
- YSFG Trend: Down.
Swing Pivots
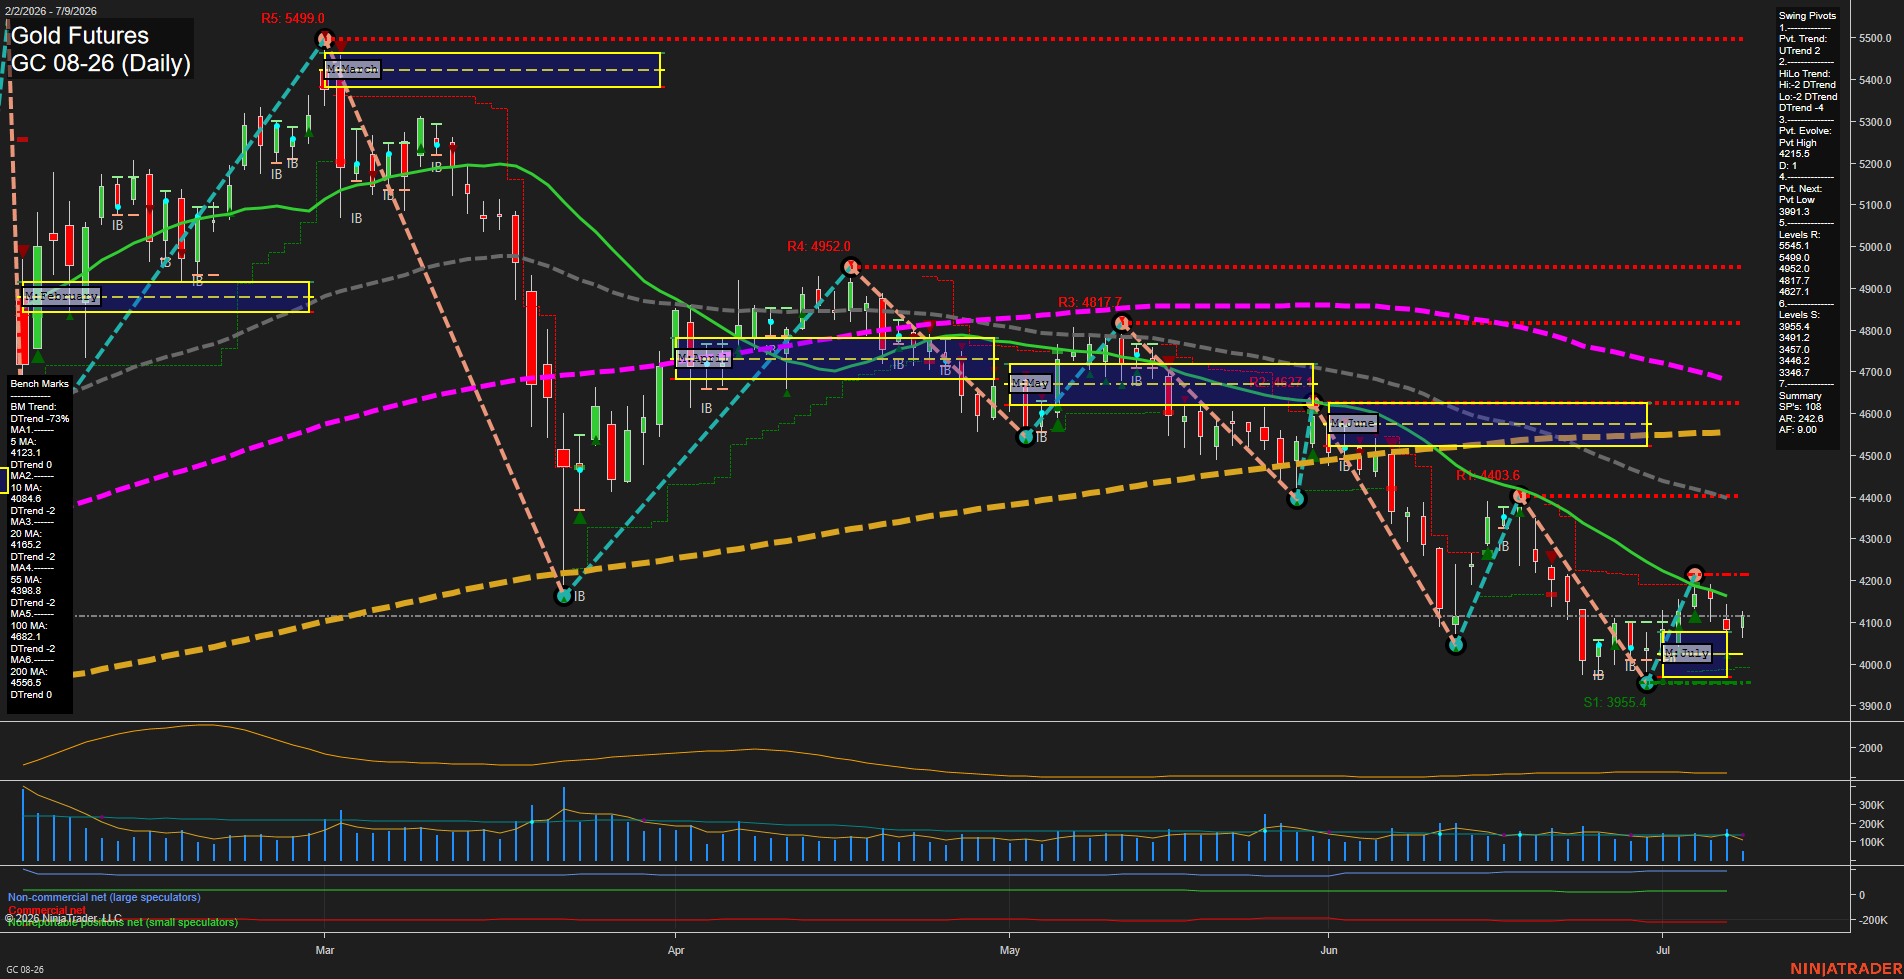
- (Short-Term) 1. Pvt. Trend: UTrend,
- (Intermediate-Term) 2. HiLo Trend: DTrend,
- 3. Pvt. Evolve: Pvt High 4215.5,
- 4. Pvt. Next: Pvt Low 3991.3,
- 5. Levels R: 5545.1, 5499.0, 4952.0, 4817.7, 4627.1,
- 6. Levels S: 3955.4, 3491.2, 3457.0, 3446.2, 3367.0.
Daily Benchmarks
- (Short-Term) 5 Day: 4123.1 Down Trend,
- (Short-Term) 10 Day: 4084.6 Down Trend,
- (Intermediate-Term) 20 Day: 4105.2 Down Trend,
- (Intermediate-Term) 55 Day: 4398.8 Down Trend,
- (Long-Term) 100 Day: 4682.1 Down Trend,
- (Long-Term) 200 Day: 4556.5 Down Trend.
Additional Metrics
Recent Trade Signals
- 08 Jul 2026: Short GC 08-26 @ 4134.4 Signals.USAR-WSFG
- 07 Jul 2026: Long GC 08-26 @ 4135.4 Signals.USAR-MSFG
- 01 Jul 2026: Long GC 08-26 @ 4095.5 Signals.USAR.TR120
Overall Rating
- Short-Term: Bearish,
- Intermediate-Term: Bearish,
- Long-Term: Bearish.
Key Insights Summary
Gold futures are trading in a lower-high, lower-low sequence with price pressing below the short-term benchmark cluster and under the declining 20/55/100/200-day structure. The short-term pivot trend is still marked UTrend, but the broader HiLo pivot structure remains DTrend, reflecting a market that has been unable to reclaim prior resistance zones after repeated rejection from the 4,200 to 4,400 area. Weekly session fib remains below bias while the monthly session fib is still positive, creating a mixed but fragile medium-term backdrop. Recent trade signals show a shift from the July 7 long to the July 8 short, matching the latest swing failure and downside continuation into the July low box. Overall, the chart presents a bearish swing profile with rally attempts getting sold into overhead resistance and momentum still aligned with the downside trend.
Chart Analysis ATS AI Generated: 2026-07-09 07:04 for Informational use only, not trading advice. Terms and Risk Disclosure Copyright © 2026. Algo Trading Systems LLC.