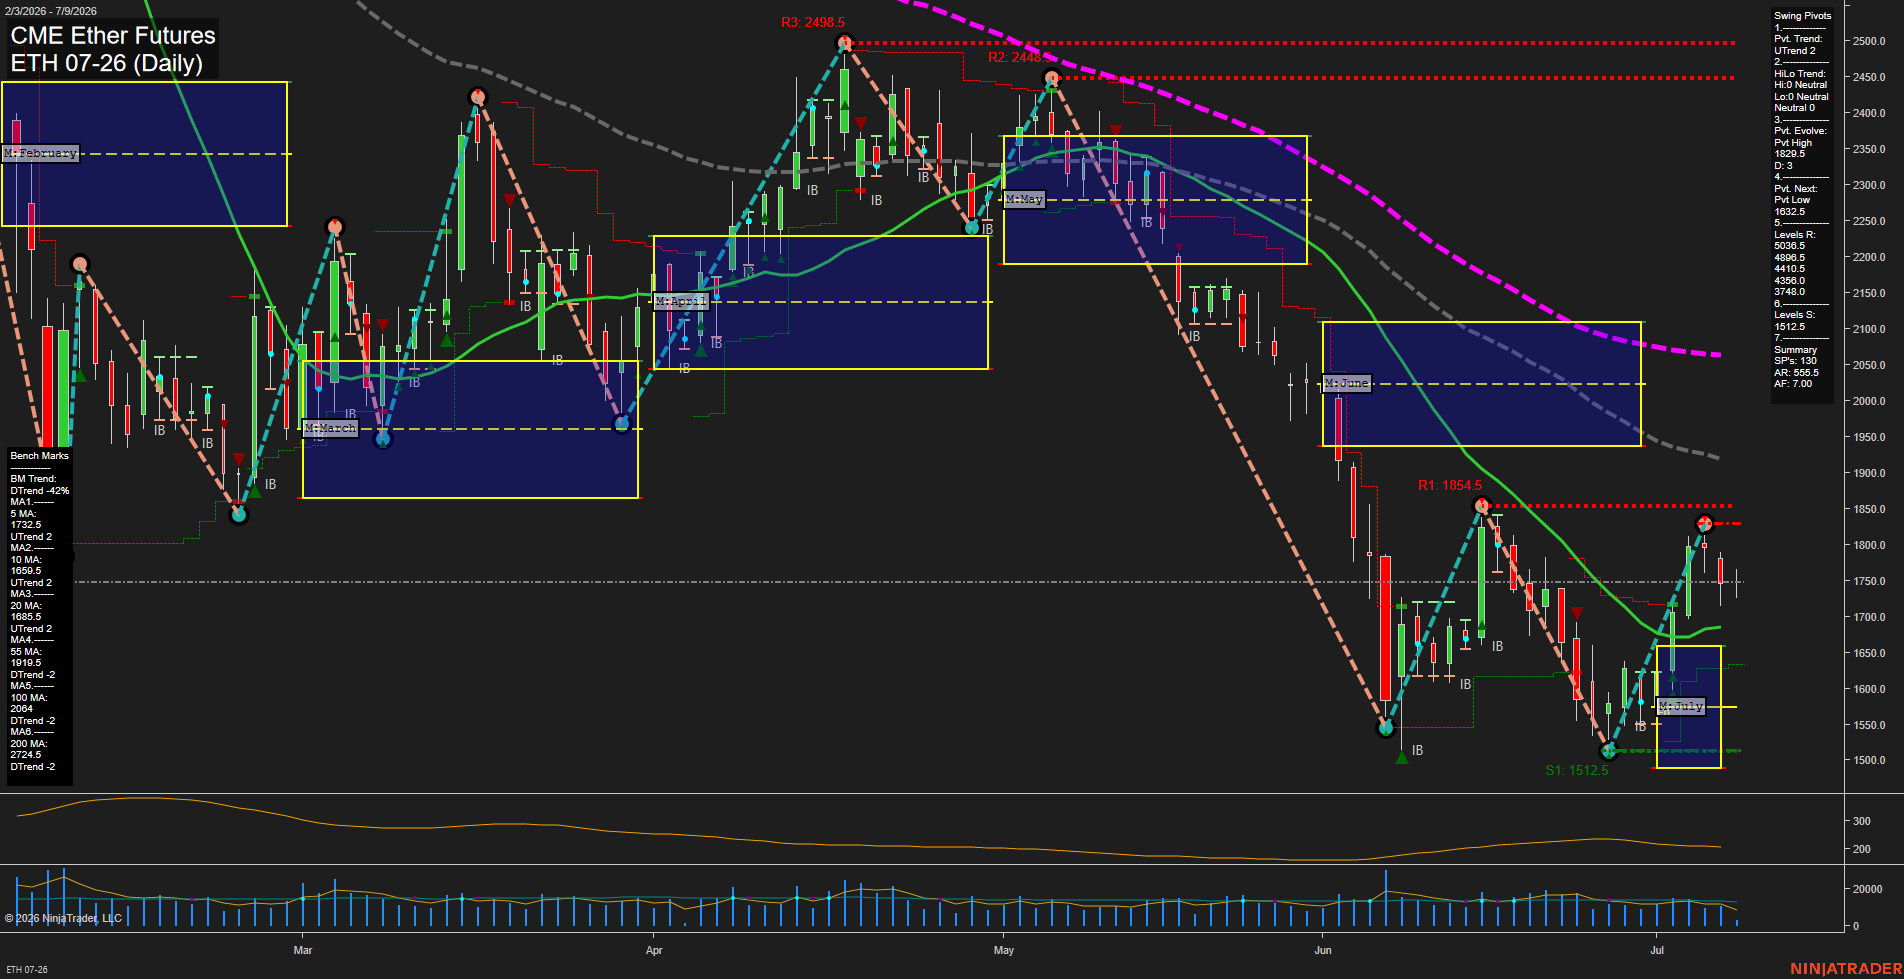
ETH CME Ether Futures Daily Chart Analysis: 2026-Jul-09 07:03 CT
Price Action
- Last: 1755.5,
- Bars: Medium,
- Mom: Fast.
WSFG Weekly
- Short-Term
- WSFG Current: -11%
- F0%/NTZ' Bias: Price Below,
- WSFG Trend: Down.
MSFG Month Jul
- Intermediate-Term
- MSFG Current: 32%
- F0%/NTZ' Bias: Price Above,
- MSFG Trend: Up.
YSFG Year 2026
- Long-Term
- YSFG Current: -49%
- F0%/NTZ' Bias: Price Below,
- YSFG Trend: Down.
Swing Pivots
- (Short-Term) 1. Pvt. Trend: UTrend,
- (Intermediate-Term) 2. HiLo Trend: UTrend,
- 3. Pvt. Evolve: Pvt High 1829.5,
- 4. Pvt. Next: Pvt Low 1832.5,
- 5. Levels R: 5036.5, 4898.5, 4410.5, 4356.0, 3748.0,
- 6. Levels S: 1512.5.
Daily Benchmarks
- (Short-Term) 5 Day: 1732.5 Up Trend,
- (Short-Term) 10 Day: 1659.5 Up Trend,
- (Intermediate-Term) 20 Day: 1685.5 Up Trend,
- (Intermediate-Term) 55 Day: 1919.5 Down Trend,
- (Long-Term) 100 Day: 2064 Down Trend,
- (Long-Term) 200 Day: 2724.5 Down Trend.
Additional Metrics
Recent Trade Signals
- 08 Jul 2026: Short ETH 07-26 @ 1740 Signals.USAR.TR120
- 08 Jul 2026: Short ETH 07-26 @ 1738.5 Signals.USAR-WSFG
- 02 Jul 2026: Long ETH 07-26 @ 1644.5 Signals.USAR-MSFG
- 09 Jul 2026: Short ETH 07-26 @ 1755.5 Signals.USAR.TR720
Overall Rating
- Short-Term: Bearish,
- Intermediate-Term: Bearish,
- Long-Term: Bearish.
Key Insights Summary
The daily structure remains in a broad downtrend from the May peak, with price still trading under the 55, 100, and 200 day benchmarks while the shorter 5, 10, and 20 day averages have turned up into a rebound phase. That creates a mixed but still pressure-heavy tape: the recent rally has recovered from the June lows and pushed back into the mid-1700s, yet the higher-timeframe benchmark stack remains bearish and the weekly and yearly session fib grids both sit with price below their NTZ midlines. Swing pivots show a short-term up pivot sequence off the June low, but the larger pivot map still reflects a lower-high/lower-low environment after the failed push from the May highs. The recent signal cluster reinforces a two-way market: the early July long from the MSFG low was followed by short signals as price retraced into the upper 1700s, leaving the chart in a transitional phase where the rebound is underway inside a broader bearish cycle.
Chart Analysis ATS AI Generated: 2026-07-09 07:03 for Informational use only, not trading advice. Terms and Risk Disclosure Copyright © 2026. Algo Trading Systems LLC.