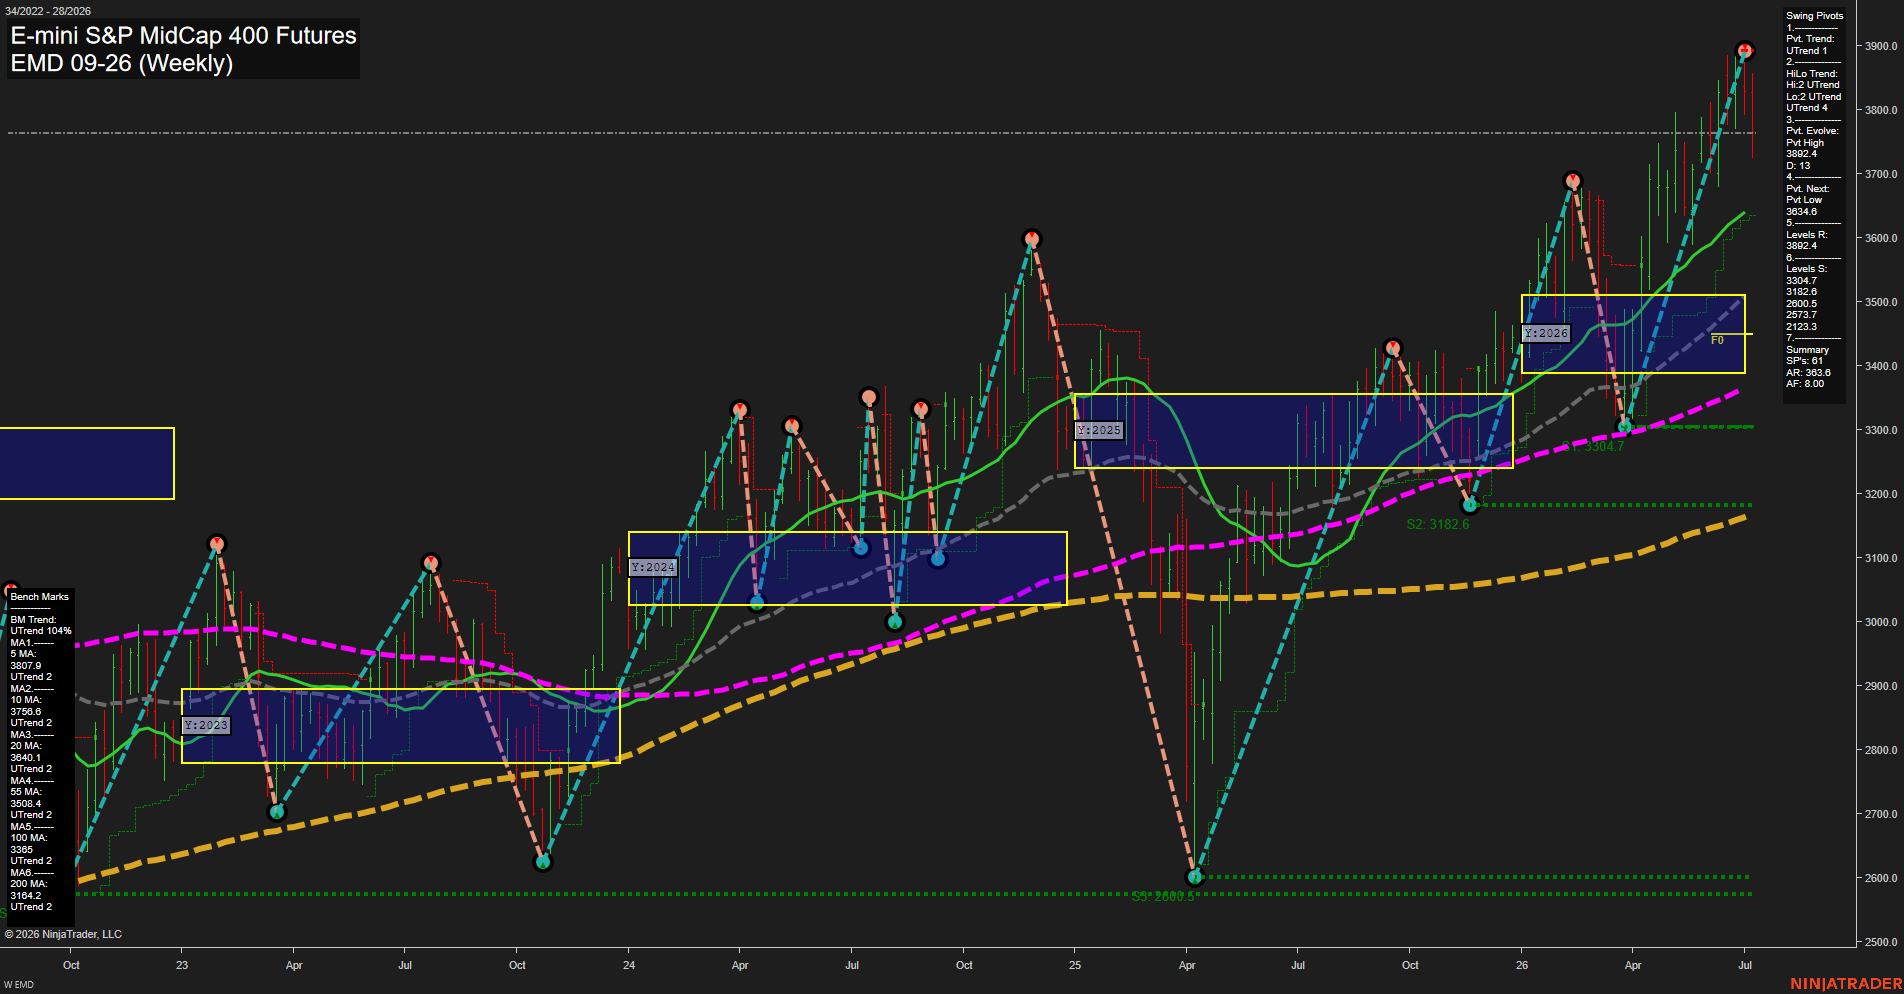
EMD E-mini S&P MidCap 400 Futures Weekly Chart Analysis: 2026-Jul-09 07:02 CT
Price Action
- Last: 3892.4,
- Bars: Large,
- Mom: fast.
WSFG Weekly
- Short-Term
- WSFG Current: -49%
- F0%/NTZ' Bias: Price Below,
- WSFG Trend: Down.
MSFG Month Jul
- Intermediate-Term
- MSFG Current: -44%
- F0%/NTZ' Bias: Price Below,
- MSFG Trend: Down.
YSFG Year 2026
- Long-Term
- YSFG Current: 52%
- F0%/NTZ' Bias: Price Above,
- YSFG Trend: Up.
Swing Pivots
- (Short-Term) 1. Pvt. Trend: UTrend,
- (Intermediate-Term) 2. HiLo Trend: UTrend,
- 3. Pvt. Evolve: Pvt High 3892.4,
- 4. Pvt. Next: Pvt Low 3834.6,
- 5. Levels R: 3892.4,
- 6. Levels S: 3304.7, 3182.6, 2800.5, 2573.7, 2123.3.
Weekly Benchmarks
- (Short-Term) 5 Day: 3807.9 Up Trend,
- (Short-Term) 10 Day: 3756.8 Up Trend,
- (Intermediate-Term) 20 Day: 3640.1 Up Trend,
- (Intermediate-Term) 55 Day: 3508.4 Up Trend,
- (Long-Term) 100 Day: 3365.0 Up Trend,
- (Long-Term) 200 Day: 3164.2 Up Trend.
Recent Trade Signals
- 08 Jul 2026: Short EMD 09-26 @ 3726.4 Signals.USAR.TR720
- 07 Jul 2026: Short EMD 09-26 @ 3805.3 Signals.USAR-WSFG
- 02 Jul 2026: Short EMD 09-26 @ 3829 Signals.USAR-MSFG
Overall Rating
- Short-Term: Bullish,
- Intermediate-Term: Bullish,
- Long-Term: Bullish.
Key Insights Summary
The weekly chart is in a dominant uptrend with price pressing into fresh highs near 3892.4, keeping the pivot structure and all major benchmarks aligned higher. The short-term and monthly session fib grids remain below their F0% references, reflecting a recent pullback phase inside a broader advance, while the yearly grid stays above F0%, confirming the larger bullish cycle. Swing pivots remain in UTrend across both short-term and HiLo measures, with the latest pivot high established at 3892.4 and the next opposing pivot low marked at 3834.6. Price is well above the 20, 55, 100, and 200-day benchmarks, showing a stacked bullish moving-average profile. Recent signals show a sequence of short entries into strength, consistent with a stretched but still upward trending market that has been cycling through rallies, retracements, and continuation bursts within an expanding weekly uptrend.
Chart Analysis ATS AI Generated: 2026-07-09 07:02 for Informational use only, not trading advice. Terms and Risk Disclosure Copyright © 2026. Algo Trading Systems LLC.