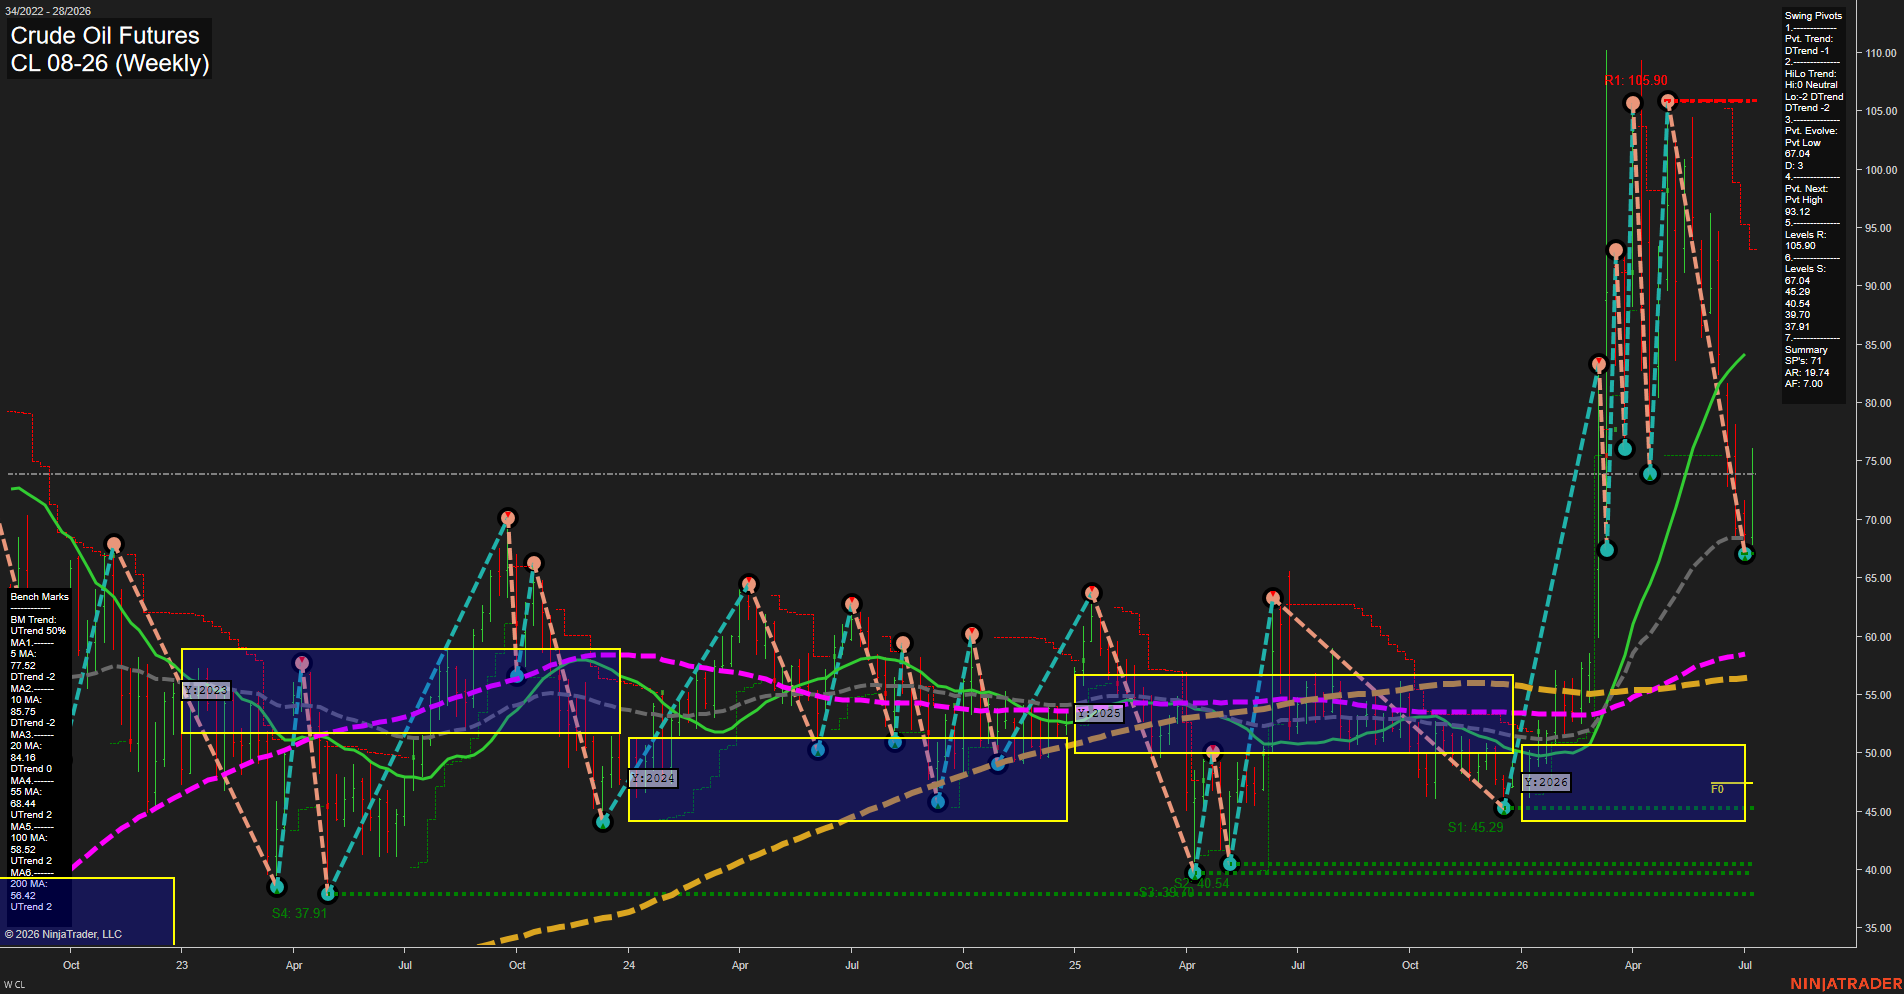
CL Crude Oil Futures Weekly Chart Analysis: 2026-Jul-09 07:01 CT
Price Action
- Last: 67.04,
- Bars: Large,
- Mom: fast.
WSFG Weekly
- Short-Term
- WSFG Current: 63%
- F0%/NTZ' Bias: Price Above,
- WSFG Trend: Up.
MSFG Month Jul
- Intermediate-Term
- MSFG Current: 15%
- F0%/NTZ' Bias: Price Above,
- MSFG Trend: Up.
YSFG Year 2026
- Long-Term
- YSFG Current: 81%
- F0%/NTZ' Bias: Price Above,
- YSFG Trend: Up.
Swing Pivots
- (Short-Term) 1. Pvt. Trend: DTrend,
- (Intermediate-Term) 2. HiLo Trend: DTrend,
- 3. Pvt. Evolve: Pvt Low 67.04,
- 4. Pvt. Next: Pvt High 93.12,
- 5. Levels R: 105.90,
- 6. Levels S: 67.04, 45.29, 40.54, 39.70, 37.91.
Weekly Benchmarks
- (Short-Term) 5 Day: 77.52 Down Trend,
- (Short-Term) 10 Day: 85.76 Down Trend,
- (Intermediate-Term) 20 Day: 84.16 Down Trend,
- (Intermediate-Term) 55 Day: 68.44 Down Trend,
- (Long-Term) 100 Day: 58.52 Up Trend,
- (Long-Term) 200 Day: 56.42 Up Trend.
Recent Trade Signals
- 09 Jul 2026: Long CL 08-26 @ 73.51 Signals.USAR-MSFG
- 08 Jul 2026: Long CL 08-26 @ 75.84 Signals.USAR.TR720
- 07 Jul 2026: Long CL 08-26 @ 70.04 Signals.USAR-WSFG
- 03 Jul 2026: Long CL 08-26 @ 69.2 Signals.USAR.TR120
Overall Rating
- Short-Term: Bearish,
- Intermediate-Term: Bearish,
- Long-Term: Bullish.
Key Insights Summary
Crude oil is in a sharp weekly reversal phase after a vertical rally into the 105.90 resistance area and a fast retracement back to 67.04, leaving the chart with large weekly bars and elevated momentum. The short-term swing structure is still in DTrend, with the HiLo trend also deteriorating, while the most recent pivot sequence has rolled over from a high and is now anchored by the 67.04 low. The weekly benchmarks show price under the 5, 10, 20, and 55 day averages, which reflects active downside pressure, even though the 100 and 200 day benchmarks remain in uptrend alignment and keep the broader structure constructive. The WSFG, MSFG, and YSFG grids all remain above their F0%/NTZ references and trend up, highlighting that the larger session framework is still intact despite the current weekly unwind. The recent sequence of long signals marks the prior breakout and extension phase, but the current price behavior is a counter-trend pullback with a fast decline from the upper swing band back toward the midrange support zone.
Chart Analysis ATS AI Generated: 2026-07-09 07:02 for Informational use only, not trading advice. Terms and Risk Disclosure Copyright © 2026. Algo Trading Systems LLC.