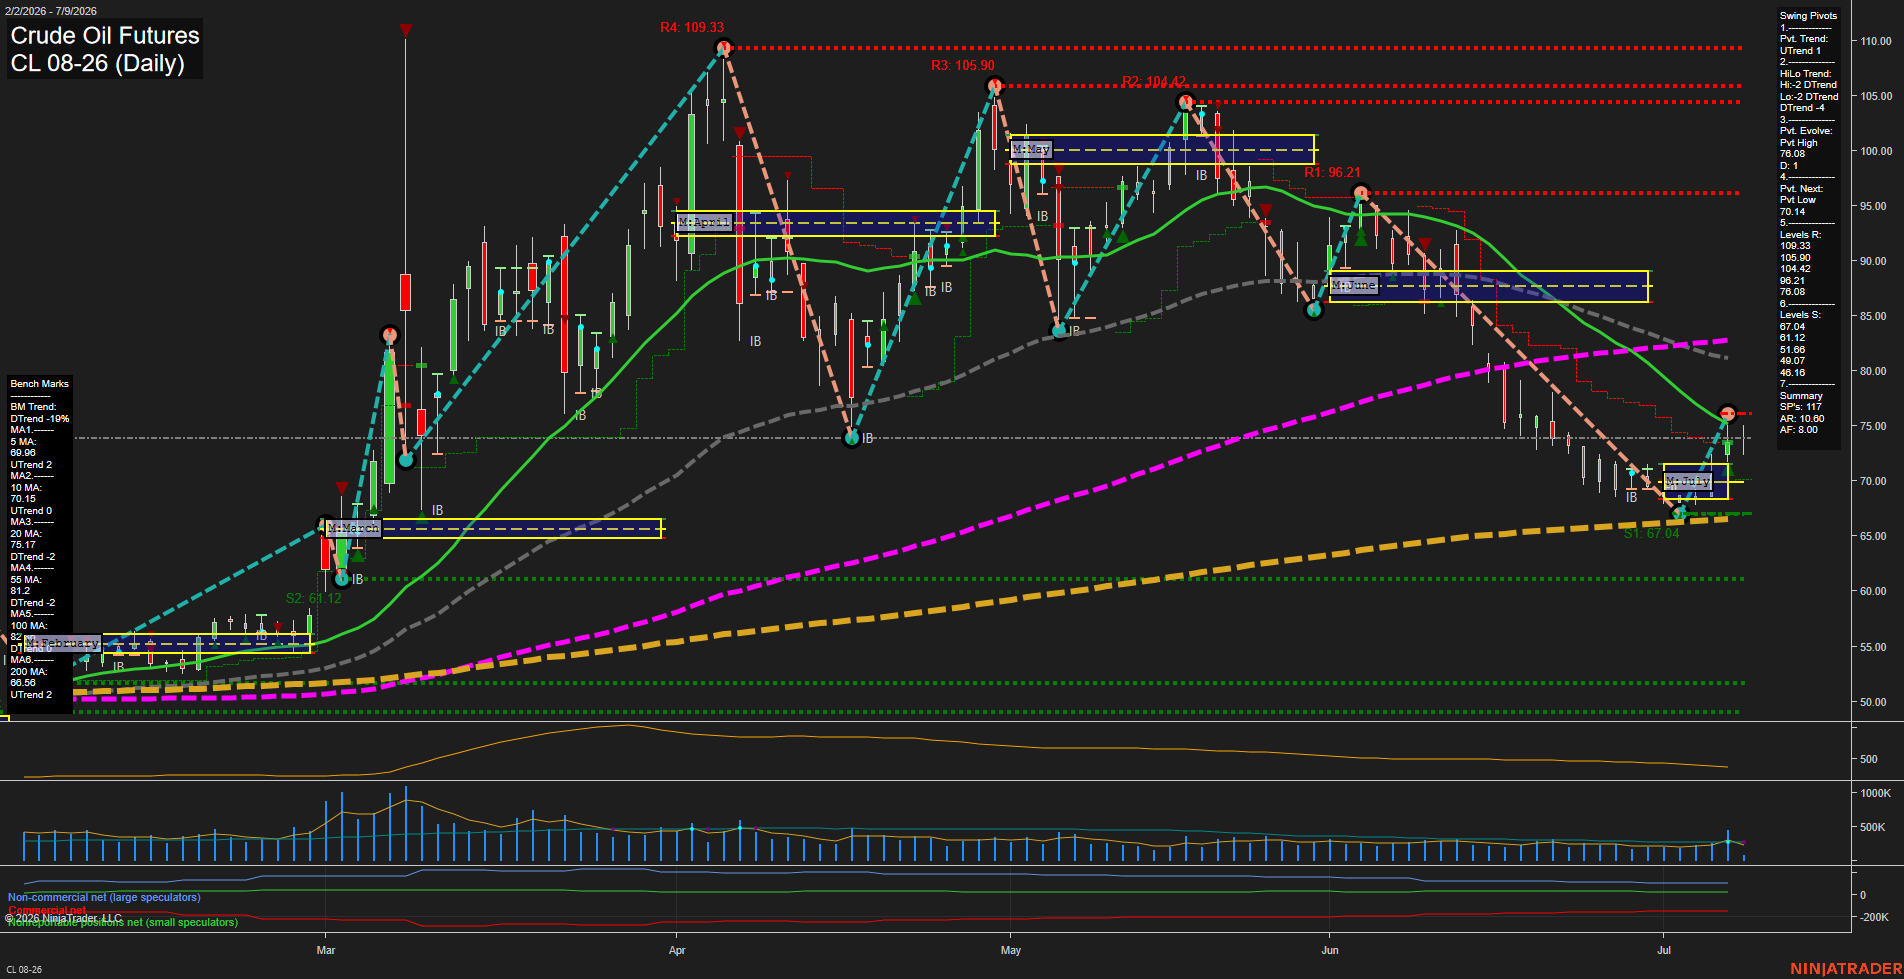
CL Crude Oil Futures Daily Chart Analysis: 2026-Jul-09 07:01 CT
Price Action
- Last: 75.84,
- Bars: Medium,
- Mom: Slow.
WSFG Weekly
- Short-Term
- WSFG Current: 63%
- F0%/NTZ' Bias: Price Above,
- WSFG Trend: Up.
MSFG Month Jul
- Intermediate-Term
- MSFG Current: 15%
- F0%/NTZ' Bias: Price Above,
- MSFG Trend: Up.
YSFG Year 2026
- Long-Term
- YSFG Current: 81%
- F0%/NTZ' Bias: Price Above,
- YSFG Trend: Up.
Swing Pivots
- (Short-Term) 1. Pvt. Trend: UTrend,
- (Intermediate-Term) 2. HiLo Trend: DTrend,
- 3. Pvt. Evolve: Pvt High 76.08,
- 4. Pvt. Next: Pvt Low 70.14,
- 5. Levels R: 109.33, 105.90, 104.42, 96.21, 76.08,
- 6. Levels S: 67.04, 61.12, 51.66, 49.07, 46.85.
Daily Benchmarks
- (Short-Term) 5 Day: 69.96 Up Trend,
- (Short-Term) 10 Day: 70.15 Up Trend,
- (Intermediate-Term) 20 Day: 75.17 Down Trend,
- (Intermediate-Term) 55 Day: 81.20 Down Trend,
- (Long-Term) 100 Day: 82.98 Down Trend,
- (Long-Term) 200 Day: 68.56 Up Trend.
Additional Metrics
- ATR: 10.60,
- VOLMA: 345883.
Recent Trade Signals
- 09 Jul 2026: Long CL 08-26 @ 73.51 Signals.USAR-MSFG
- 08 Jul 2026: Long CL 08-26 @ 75.84 Signals.USAR.TR720
- 07 Jul 2026: Long CL 08-26 @ 70.04 Signals.USAR-WSFG
- 03 Jul 2026: Long CL 08-26 @ 69.2 Signals.USAR.TR120
Overall Rating
- Short-Term: Bullish,
- Intermediate-Term: Bearish,
- Long-Term: Neutral.
Key Insights Summary
Crude oil is in a recovery phase after a sharp June decline, with price rebounding off the mid-to-upper 60s and now pressing back into the low-to-mid 70s. The short-term structure has turned constructive with the current pivot trend back to UTrend and recent long signals firing across TR120, WSFG, MSFG, and TR720. The weekly and monthly session fib grids both show price above their F0%/NTZ bias, which supports the rebound narrative. That said, the intermediate trend remains pressured because price is still trading below the 20, 55, and 100 day benchmarks, while the HiLo pivot trend is still DTrend, showing the broader swing structure has not fully repaired. The chart is transitioning from a selloff and lower-high sequence into a bounce and consolidation zone, with resistance layered near 76.08 and then 96.21, while support is clustered near 70.14 and 67.04. From a futures swing trader point of view, the tape is improving tactically, but the larger swing context is still working through the aftermath of the prior downtrend.
Chart Analysis ATS AI Generated: 2026-07-09 07:01 for Informational use only, not trading advice. Terms and Risk Disclosure Copyright © 2026. Algo Trading Systems LLC.