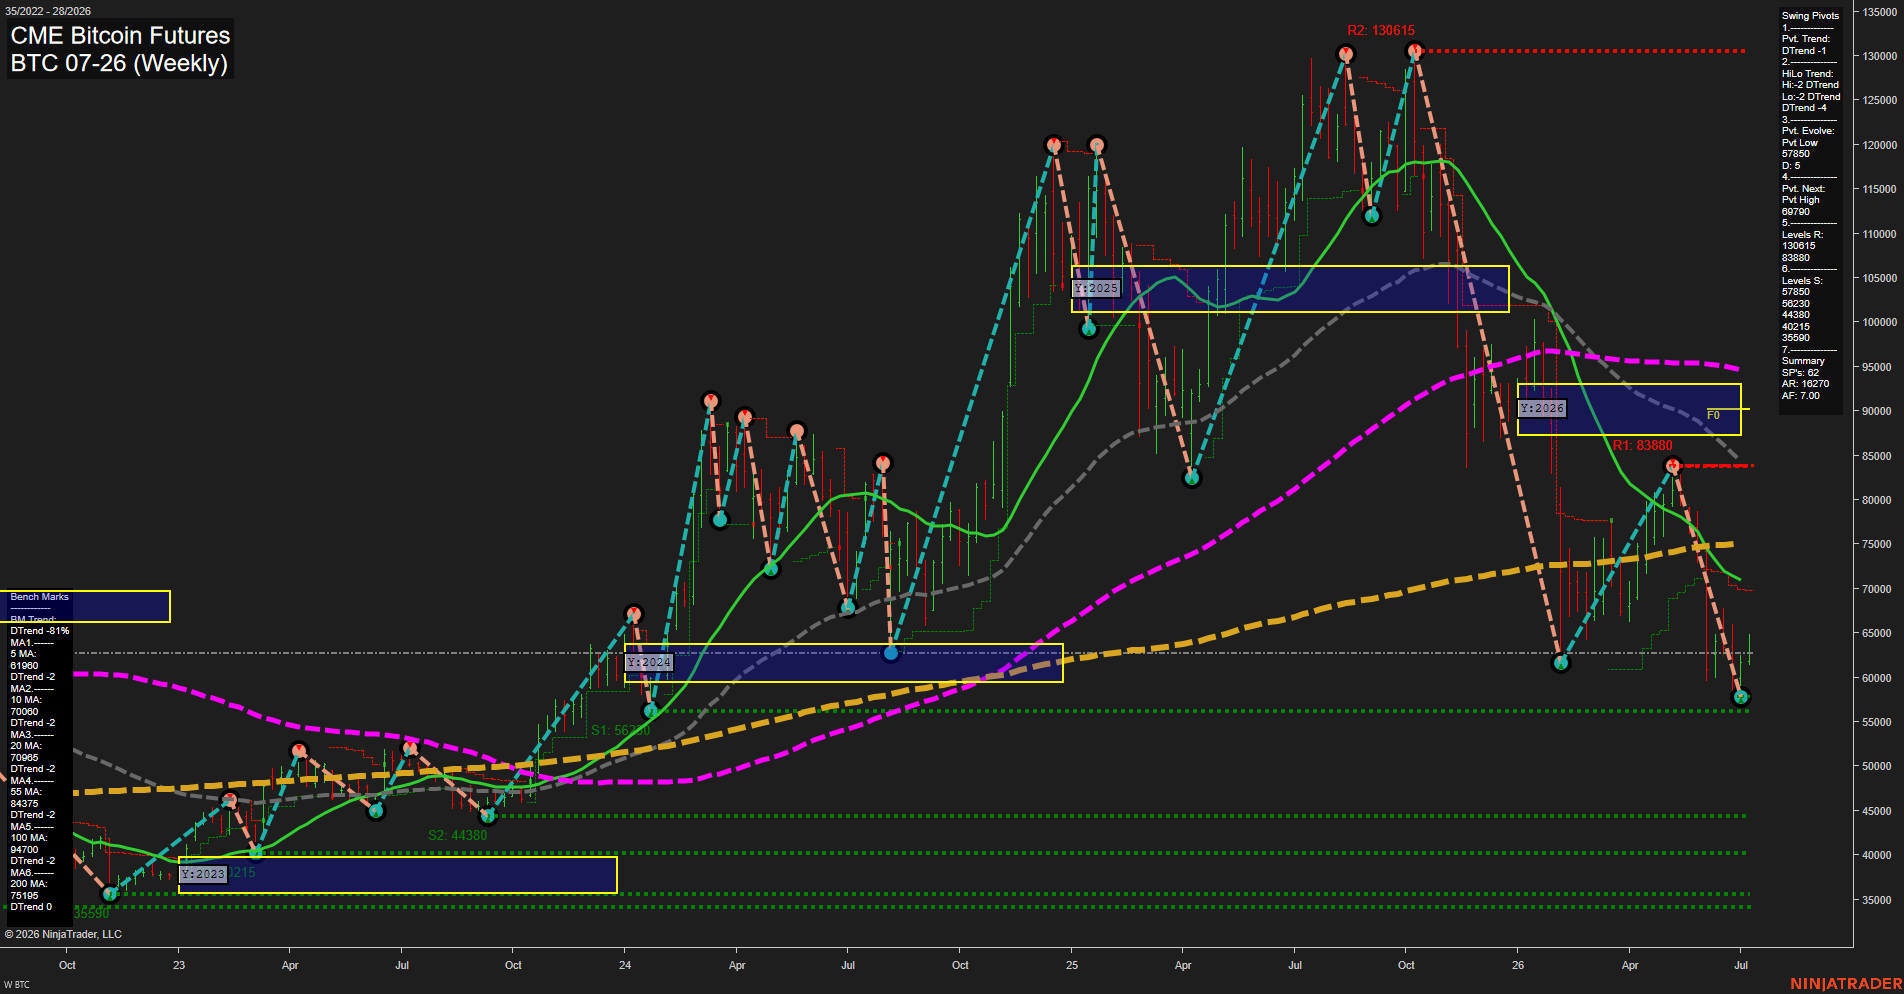
BTC CME Bitcoin Futures Weekly Chart Analysis: 2026-Jul-09 07:01 CT
Price Action
- Last: 63500,
- Bars: Large,
- Mom: Fast.
WSFG Weekly
- Short-Term
- WSFG Current: -3%
- F0%/NTZ' Bias: Price Below,
- WSFG Trend: Down.
MSFG Month Jul
- Intermediate-Term
- MSFG Current: 27%
- F0%/NTZ' Bias: Price Above,
- MSFG Trend: Up.
YSFG Year 2026
- Long-Term
- YSFG Current: -95%
- F0%/NTZ' Bias: Price Below,
- YSFG Trend: Down.
Swing Pivots
- (Short-Term) 1. Pvt. Trend: DTrend,
- (Intermediate-Term) 2. HiLo Trend: DTrend,
- 3. Pvt. Evolve: Pvt Low 57850,
- 4. Pvt. Next: Pvt High 69790,
- 5. Levels R: 130615, 83880,
- 6. Levels S: 57850, 56230, 44380, 40215, 35590.
Weekly Benchmarks
- (Short-Term) 5 Day: 61980 Down Trend,
- (Short-Term) 10 Day: 70060 Down Trend,
- (Intermediate-Term) 20 Day: 70965 Down Trend,
- (Intermediate-Term) 55 Day: 84375 Down Trend,
- (Long-Term) 100 Day: 94700 Down Trend,
- (Long-Term) 200 Day: 75105 Up Trend.
Recent Trade Signals
- 08 Jul 2026: Short BTC 07-26 @ 62185 Signals.USAR.TR120
- 08 Jul 2026: Short BTC 07-26 @ 62110 Signals.USAR-WSFG
- 07 Jul 2026: Long BTC 07-26 @ 64110 Signals.USAR.TR720
- 02 Jul 2026: Long BTC 07-26 @ 61265 Signals.USAR-MSFG
Overall Rating
- Short-Term: Bearish,
- Intermediate-Term: Bearish,
- Long-Term: Bearish.
Key Insights Summary
BTC CME weekly structure is in a dominant downside swing with a large, fast weekly selloff pressing price back toward the lower pivot band near 57,850 after failure from the 2026 highs. Short-term action is aligned with the weekly session grid and pivot trend to the downside, with price below the weekly F0/NTZ midpoint and recent signals favoring shorts. The monthly session grid still reads positive on a relative basis, but the broader benchmark stack remains heavy as price sits below the 20, 55, and 100 day measures, while the yearly grid is deeply negative and confirms a long-term bearish backdrop. The chart is showing lower highs and lower lows, with overhead resistance concentrated at 83,880 and then 130,615, while nearby support is clustered at 57,850, 56,230, and 44,380. Overall, the tape reflects a sharp retracement within a larger volatility cycle, with the current swing phase still controlled by downside follow-through.
Chart Analysis ATS AI Generated: 2026-07-09 07:01 for Informational use only, not trading advice. Terms and Risk Disclosure Copyright © 2026. Algo Trading Systems LLC.