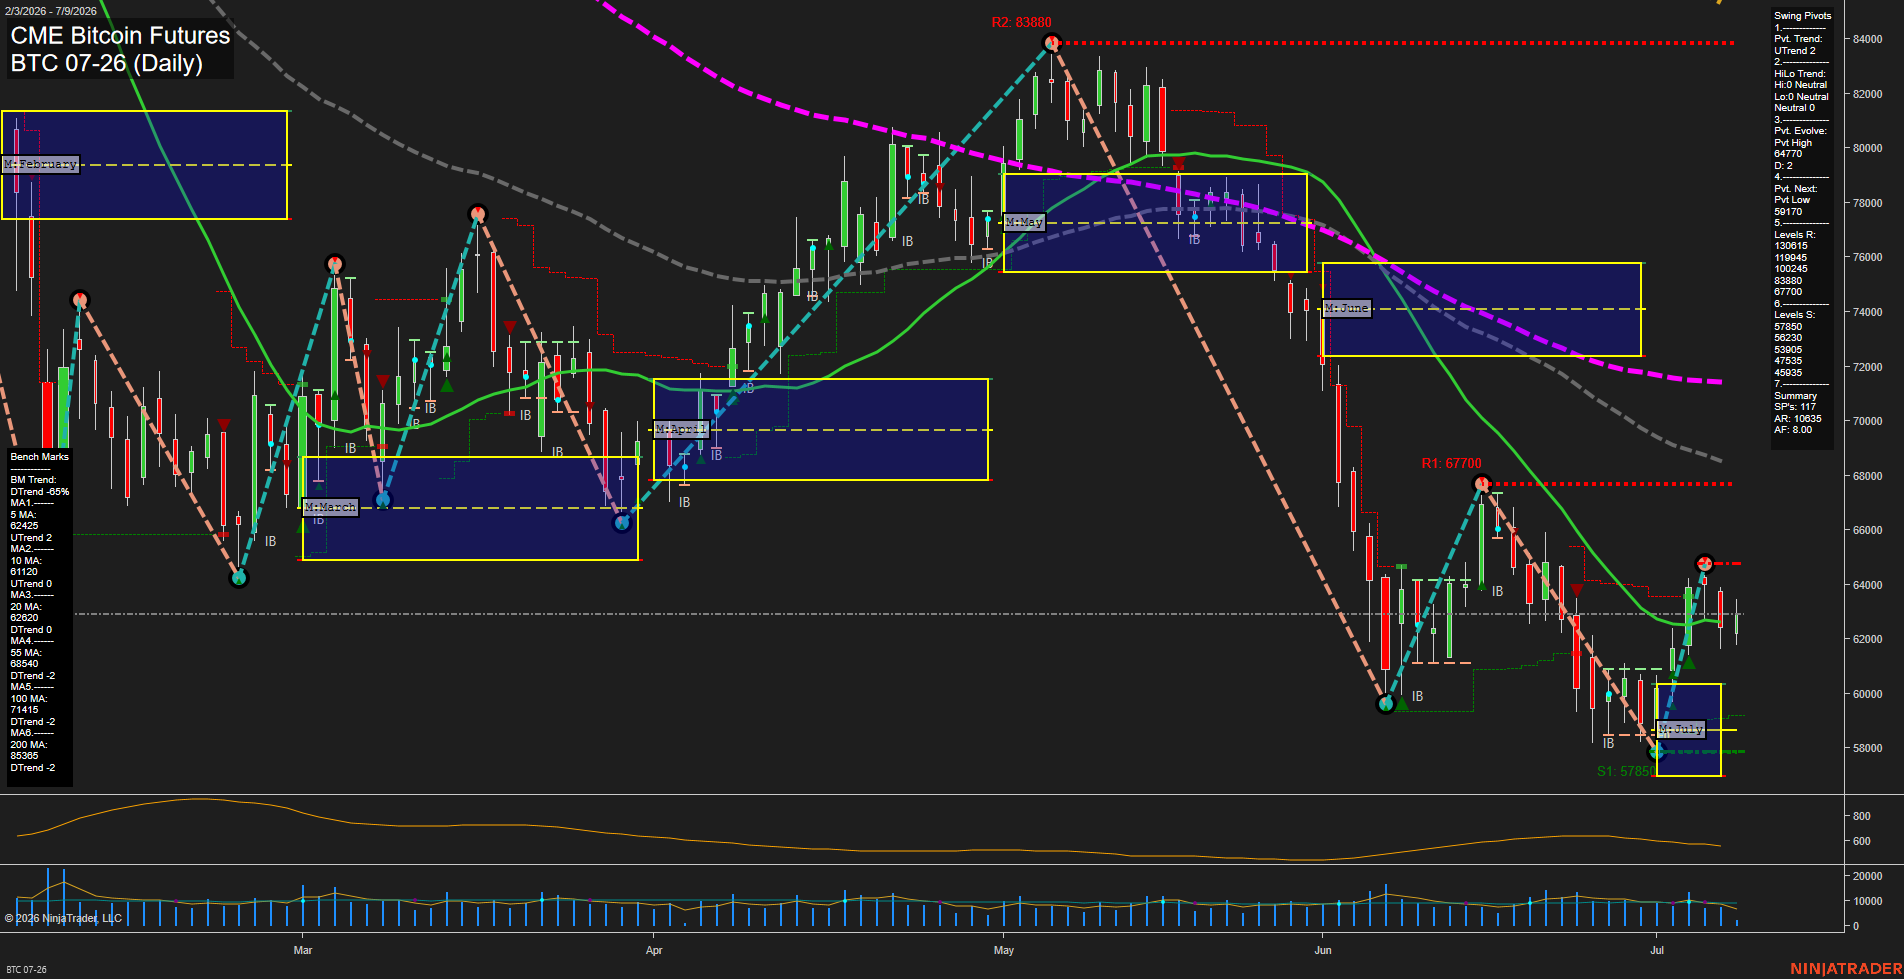
BTC CME Bitcoin Futures Daily Chart Analysis: 2026-Jul-09 07:01 CT
Price Action
- Last: 62750,
- Bars: Medium,
- Mom: Fast.
WSFG Weekly
- Short-Term
- WSFG Current: -3%
- F0%/NTZ' Bias: Price Below,
- WSFG Trend: Down.
MSFG Month Jul
- Intermediate-Term
- MSFG Current: 27%
- F0%/NTZ' Bias: Price Above,
- MSFG Trend: Up.
YSFG Year 2026
- Long-Term
- YSFG Current: -95%
- F0%/NTZ' Bias: Price Below,
- YSFG Trend: Down.
Swing Pivots
- (Short-Term) 1. Pvt. Trend: UTrend,
- (Intermediate-Term) 2. HiLo Trend: Neutral,
- 3. Pvt. Evolve: Pvt High 64770,
- 4. Pvt. Next: Pvt Low 59170,
- 5. Levels R: 130815, 119945, 100245, 83880, 67700,
- 6. Levels S: 57850, 56230, 53935, 47535, 45935.
Daily Benchmarks
- (Short-Term) 5 Day: 62425 Up Trend,
- (Short-Term) 10 Day: 61120 Up Trend,
- (Intermediate-Term) 20 Day: 62620 Down Trend,
- (Intermediate-Term) 55 Day: 68540 Down Trend,
- (Long-Term) 100 Day: 71415 Down Trend,
- (Long-Term) 200 Day: 85385 Down Trend.
Additional Metrics
Recent Trade Signals
- 08 Jul 2026: Short BTC 07-26 @ 62185 Signals.USAR.TR120
- 08 Jul 2026: Short BTC 07-26 @ 62110 Signals.USAR-WSFG
- 07 Jul 2026: Long BTC 07-26 @ 64110 Signals.USAR.TR720
- 02 Jul 2026: Long BTC 07-26 @ 61265 Signals.USAR-MSFG
Overall Rating
- Short-Term: Bearish,
- Intermediate-Term: Bearish,
- Long-Term: Bearish.
Key Insights Summary
Price is trading in the lower portion of the recent July NTZ after a sharp selloff from the 67,700 swing resistance and the 64,770 pivot high, with the daily structure still showing a volatile rebound attempt inside a broader down sequence. Short-term session context is weak with weekly fib bias below F0% and the weekly trend down, while the monthly July fib remains positive above F0% and still reflects an intermediate up phase that has not yet fully resolved into trend recovery. The moving average stack is mixed near the front end but remains decisively bearish on the larger horizons, with price below the 20, 55, 100, and 200 day benchmarks and the longer averages sloping down. Swing pivot structure is still working lower toward the 59,170 next downside pivot, while broader resistance remains layered overhead at 67,700, 83,880, and higher legacy pivot levels. The tape reflects a large-range corrective phase with recent countertrend longs and fresh short signals aligning with a market that is still digesting the prior rally and now transitioning into a weaker, lower-high / lower-low daily cycle.
Chart Analysis ATS AI Generated: 2026-07-09 07:01 for Informational use only, not trading advice. Terms and Risk Disclosure Copyright © 2026. Algo Trading Systems LLC.