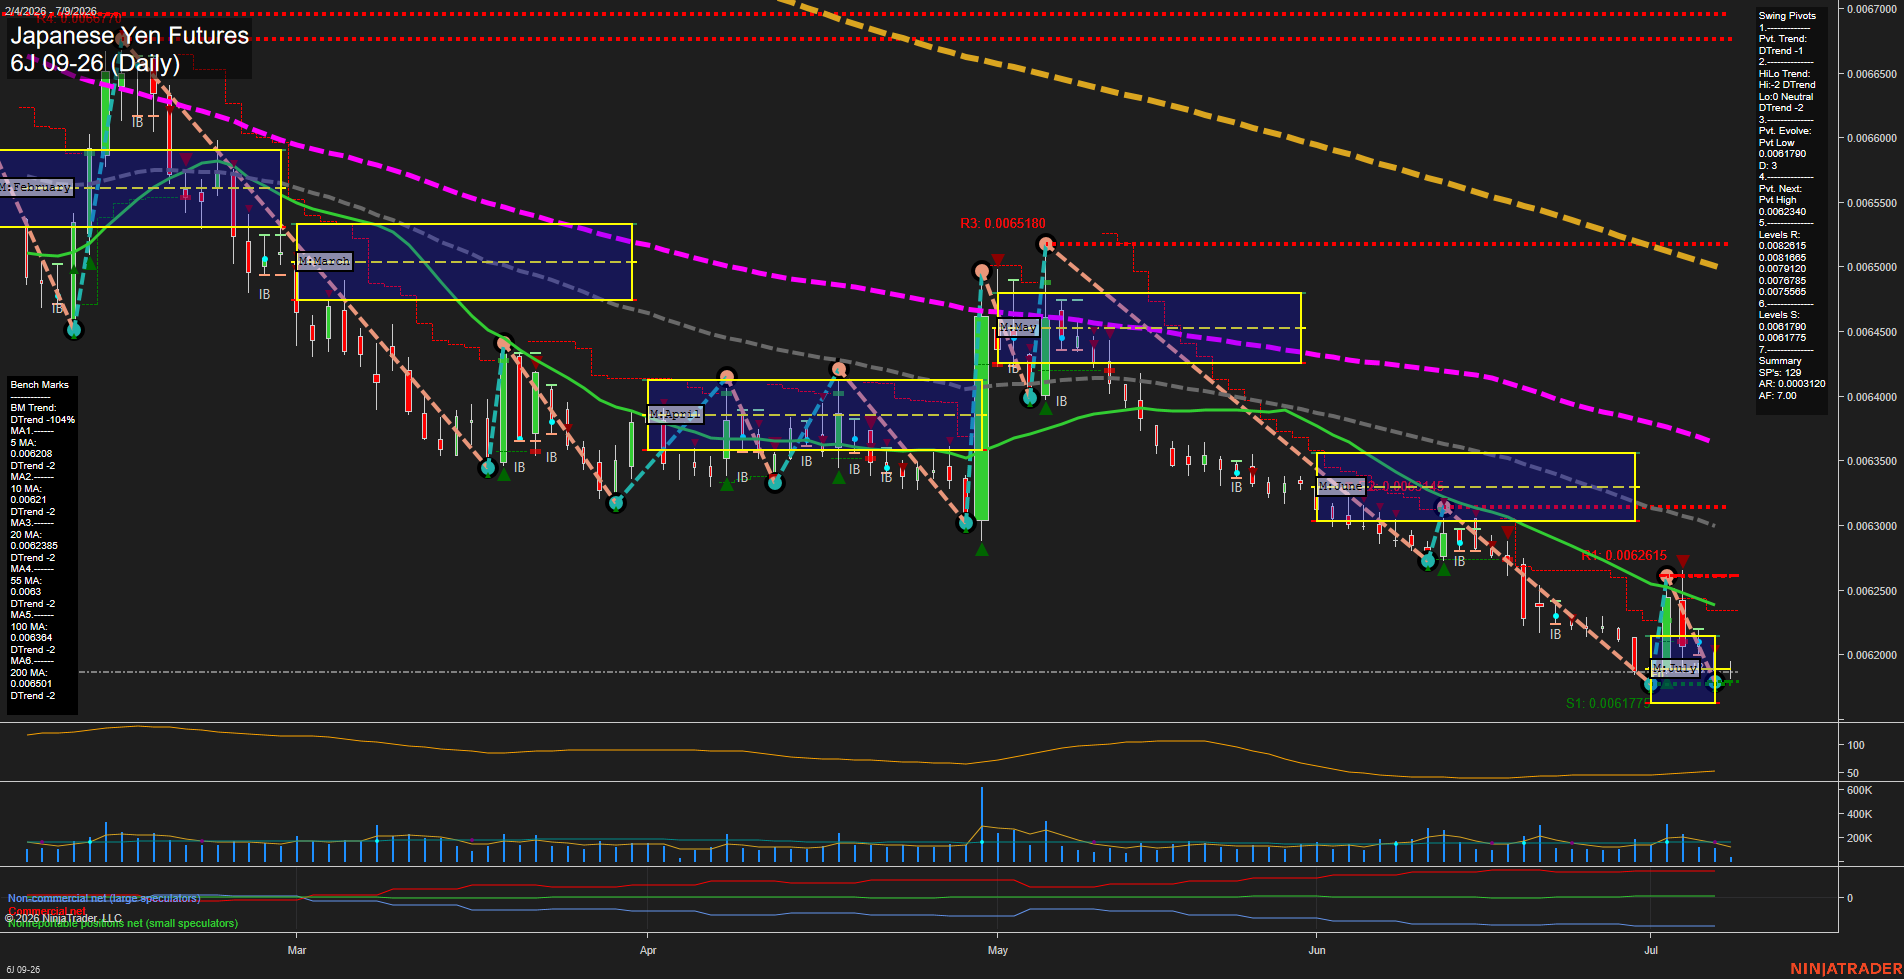
6J Japanese Yen Futures Daily Chart Analysis: 2026-Jul-09 07:01 CT
Price Action
- Last: 0.0061770,
- Bars: Small,
- Mom: Slow.
WSFG Weekly
- Short-Term
- WSFG Current: -77%
- F0%/NTZ' Bias: Price Below,
- WSFG Trend: Down.
MSFG Month Jul
- Intermediate-Term
- MSFG Current: 5%
- F0%/NTZ' Bias: Price Above,
- MSFG Trend: Up.
YSFG Year 2026
- Long-Term
- YSFG Current: -27%
- F0%/NTZ' Bias: Price Below,
- YSFG Trend: Down.
Swing Pivots
- (Short-Term) 1. Pvt. Trend: DTrend,
- (Intermediate-Term) 2. HiLo Trend: DTrend,
- 3. Pvt. Evolve: Pvt Low 0.0061790,
- 4. Pvt. Next: Pvt High 0.0062340,
- 5. Levels R: 0.0082615, 0.0081605, 0.0079120, 0.0076785, 0.0075565,
- 6. Levels S: 0.0061790, 0.0061775.
Daily Benchmarks
- (Short-Term) 5 Day: 0.0062080 Down Trend,
- (Short-Term) 10 Day: 0.0062100 Down Trend,
- (Intermediate-Term) 20 Day: 0.0062385 Down Trend,
- (Intermediate-Term) 55 Day: 0.0063000 Down Trend,
- (Long-Term) 100 Day: 0.0063840 Down Trend,
- (Long-Term) 200 Day: 0.0065010 Down Trend.
Additional Metrics
Recent Trade Signals
- 06 Jul 2026: Short 6J 09-26 @ 0.006213 Signals.USAR.TR120
- 06 Jul 2026: Short 6J 09-26 @ 0.006225 Signals.USAR-WSFG
Overall Rating
- Short-Term: Bearish,
- Intermediate-Term: Bearish,
- Long-Term: Bearish.
Key Insights Summary
The daily structure remains in a persistent downtrend with price sitting below all benchmark moving averages and below the weekly and yearly fib equilibrium zones, while only the monthly fib grid still shows a positive internal bias. Swing pivots confirm downside control with both the short-term pivot trend and the hi/lo trend in DTrend, and the latest pivot evolution has shifted to a new pivot low with the next opposite pivot defined higher above current trade. Price is compressing near the lower end of the recent range after a prolonged slide of lower highs and lower lows, reflecting a weak but orderly decline rather than an impulsive liquidation. The recent short signals align with the broader bearish trend alignment, and the current market tone is still dominated by downside structure with intermittent rebound attempts that have been capped by declining moving averages and nearby resistance shelves.
Chart Analysis ATS AI Generated: 2026-07-09 07:01 for Informational use only, not trading advice. Terms and Risk Disclosure Copyright © 2026. Algo Trading Systems LLC.