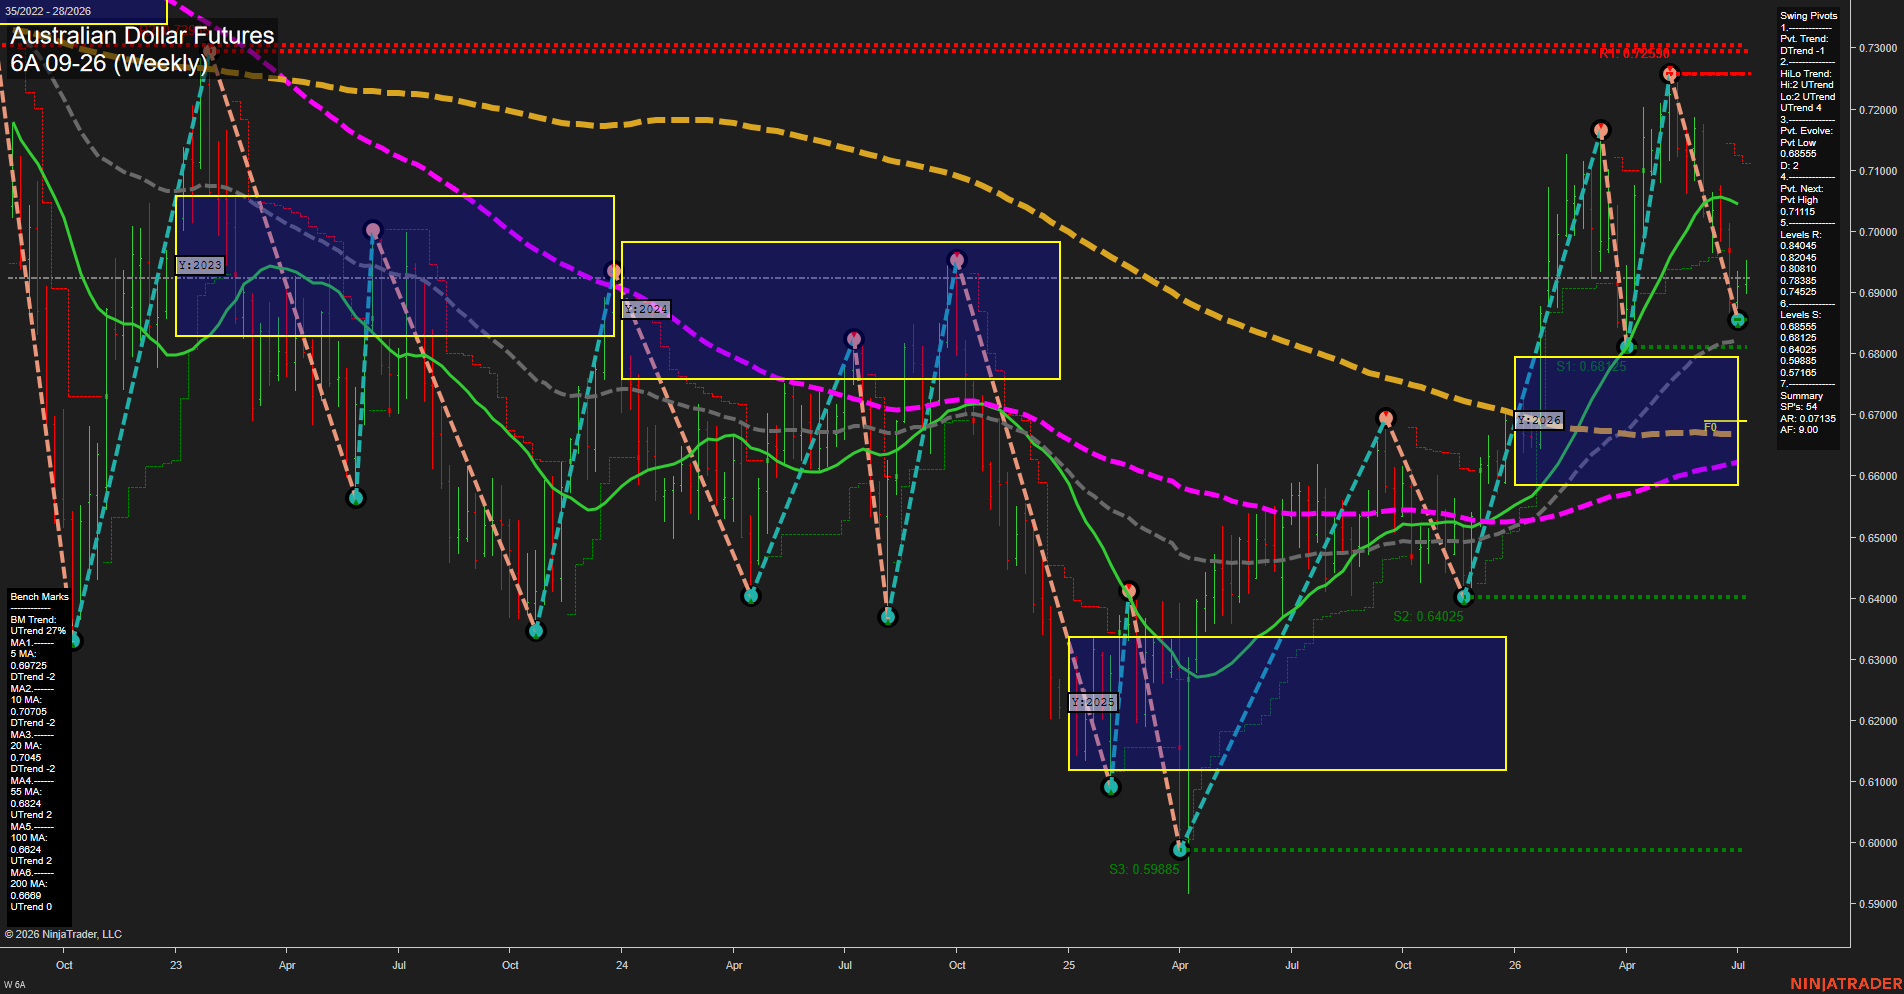
6A Australian Dollar Futures Weekly Chart Analysis: 2026-Jul-09 07:00 CT
Price Action
- Last: 0.68600,
- Bars: Large,
- Mom: Fast.
WSFG Weekly
- Short-Term
- WSFG Current: NA%
- F0%/NTZ' Bias: Price Neutral,
- WSFG Trend: Neutral.
MSFG Month Jul
- Intermediate-Term
- MSFG Current: NA%
- F0%/NTZ' Bias: Price Neutral,
- MSFG Trend: Neutral.
YSFG Year 2026
- Long-Term
- YSFG Current: NA%
- F0%/NTZ' Bias: Price Neutral,
- YSFG Trend: Neutral.
Swing Pivots
- (Short-Term) 1. Pvt. Trend: DTrend,
- (Intermediate-Term) 2. HiLo Trend: UTrend,
- 3. Pvt. Evolve: Pvt Low 0.68555,
- 4. Pvt. Next: Pvt High 0.71150,
- 5. Levels R: 0.84045, 0.82045, 0.80810, 0.78385, 0.74525,
- 6. Levels S: 0.68555, 0.68125, 0.64025, 0.59885, 0.57165.
Weekly Benchmarks
- (Short-Term) 5 Day: 0.69725 Down Trend,
- (Short-Term) 10 Day: 0.70705 Down Trend,
- (Intermediate-Term) 20 Day: 0.70450 Down Trend,
- (Intermediate-Term) 55 Day: 0.68240 Up Trend,
- (Long-Term) 100 Day: 0.66240 Up Trend,
- (Long-Term) 200 Day: 0.66800 Up Trend.
Recent Trade Signals
- 08 Jul 2026: Short 6A 09-26 @ 0.6909 Signals.USAR.TR120
- 08 Jul 2026: Short 6A 09-26 @ 0.6907 Signals.USAR-WSFG
- 07 Jul 2026: Long 6A 09-26 @ 0.69345 Signals.USAR-MSFG
Overall Rating
- Short-Term: Bearish,
- Intermediate-Term: Neutral,
- Long-Term: Bullish.
Key Insights Summary
The weekly chart shows a sharp pullback from the recent highs near 0.7259 back into the mid-0.68 area, with a fast downside impulse dominating the most recent swing. Short-term structure is weak because the pivot trend is down and price is trading below the 5, 10, and 20 day benchmarks. Intermediate structure is mixed, with the 55 day and longer benchmarks still aligned higher while the price has pulled back under the faster averages, leaving the broader weekly action in a retracement phase. Long-term structure remains constructive because the 100 day and 200 day benchmarks are still rising and the 2026 yearly grid sits in a broad neutral-to-supportive zone. The main technical feature is a test of the 0.68555 to 0.68125 support band after rejection from the upper 0.71s, while overhead resistance remains layered at 0.71150 and then higher swing levels.
Chart Analysis ATS AI Generated: 2026-07-09 07:00 for Informational use only, not trading advice. Terms and Risk Disclosure Copyright © 2026. Algo Trading Systems LLC.