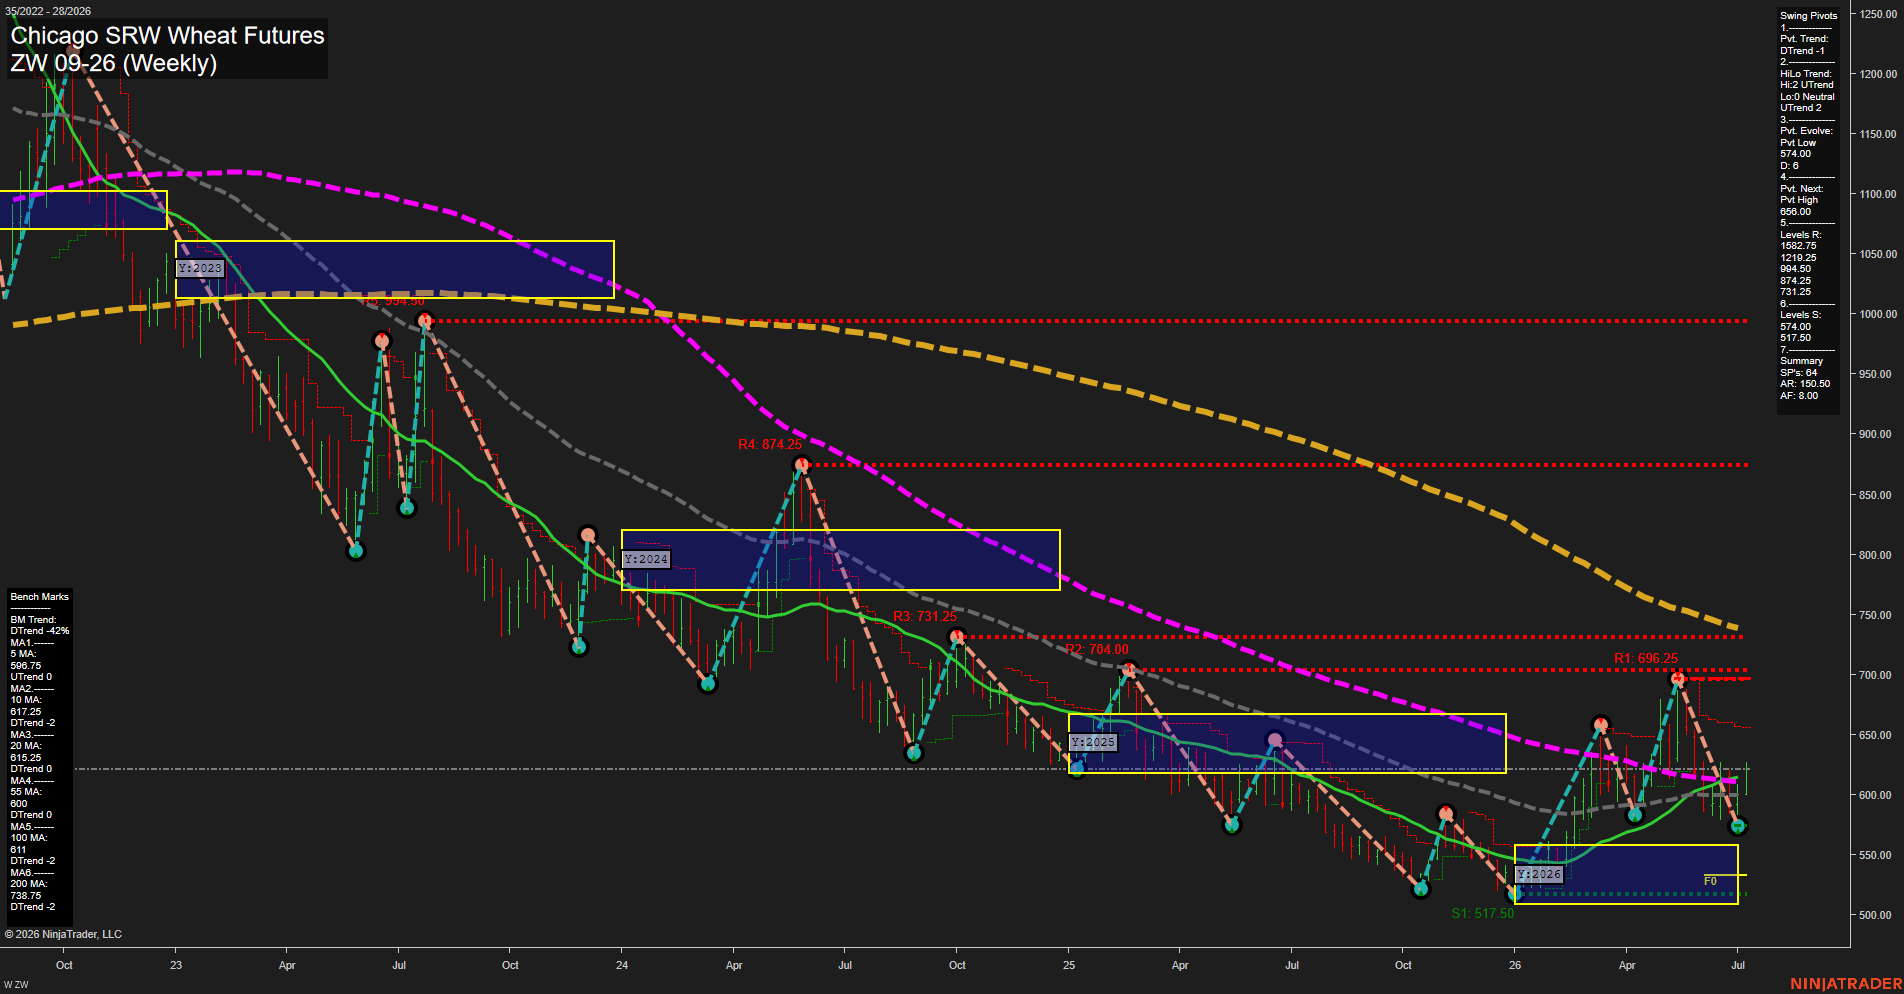
ZW Chicago SRW Wheat Futures Weekly Chart Analysis: 2026-Jul-08 07:09 CT
Price Action
- Last: 618.00,
- Bars: Large,
- Mom: average.
WSFG Weekly
- Short-Term
- WSFG Current: 58%
- F0%/NTZ' Bias: Price Above,
- WSFG Trend: Up.
MSFG Month Jul
- Intermediate-Term
- MSFG Current: 33%
- F0%/NTZ' Bias: Price Above,
- MSFG Trend: Up.
YSFG Year 2026
- Long-Term
- YSFG Current: 36%
- F0%/NTZ' Bias: Price Above,
- YSFG Trend: Up.
Swing Pivots
- (Short-Term) 1. Pvt. Trend: DTrend,
- (Intermediate-Term) 2. HiLo Trend: UTrend,
- 3. Pvt. Evolve: Pvt Low 574.00,
- 4. Pvt. Next: Pvt High 656.00,
- 5. Levels R: 1582.75, 1219.25, 994.50, 874.25, 731.25,
- 6. Levels S: 574.00, 517.50.
Weekly Benchmarks
- (Short-Term) 5 Day: 596.75 Up Trend,
- (Short-Term) 10 Day: 617.25 Down Trend,
- (Intermediate-Term) 20 Day: 615.25 Down Trend,
- (Intermediate-Term) 55 Day: 600.00 Down Trend,
- (Long-Term) 100 Day: 611.00 Down Trend,
- (Long-Term) 200 Day: 738.75 Down Trend.
Recent Trade Signals
- 07 Jul 2026: Long ZW 09-26 @ 614.75 Signals.USAR.TR720
- 06 Jul 2026: Long ZW 09-26 @ 606.5 Signals.USAR-MSFG
- 06 Jul 2026: Long ZW 09-26 @ 604.5 Signals.USAR-WSFG
- 01 Jul 2026: Long ZW 09-26 @ 593.5 Signals.USAR.TR120
Overall Rating
- Short-Term: Bullish,
- Intermediate-Term: Bullish,
- Long-Term: Neutral.
Key Insights Summary
Wheat is in a broad multi-year downtrend, but the latest weekly structure has stabilized into a recovery phase above the weekly, monthly, and yearly Fib Grid midlines. Recent long signals across TR120, WSFG, MSFG, and TR720 show improving upside participation, while the swing pivot profile still shows a short-term down pivot trend, signaling that the market is transitioning rather than fully reversed. Price is working above the 5-day and near the 10/20-day benchmarks, suggesting a developing rebound with overhead resistance still defined by the declining 55-, 100-, and especially 200-day benchmarks. The chart reflects a countertrend rally inside a larger bearish legacy, with higher-low behavior from the 2026 lows and a near-term push toward the next pivot high zone around 656.
Chart Analysis ATS AI Generated: 2026-07-08 07:09 for Informational use only, not trading advice. Terms and Risk Disclosure Copyright © 2026. Algo Trading Systems LLC.