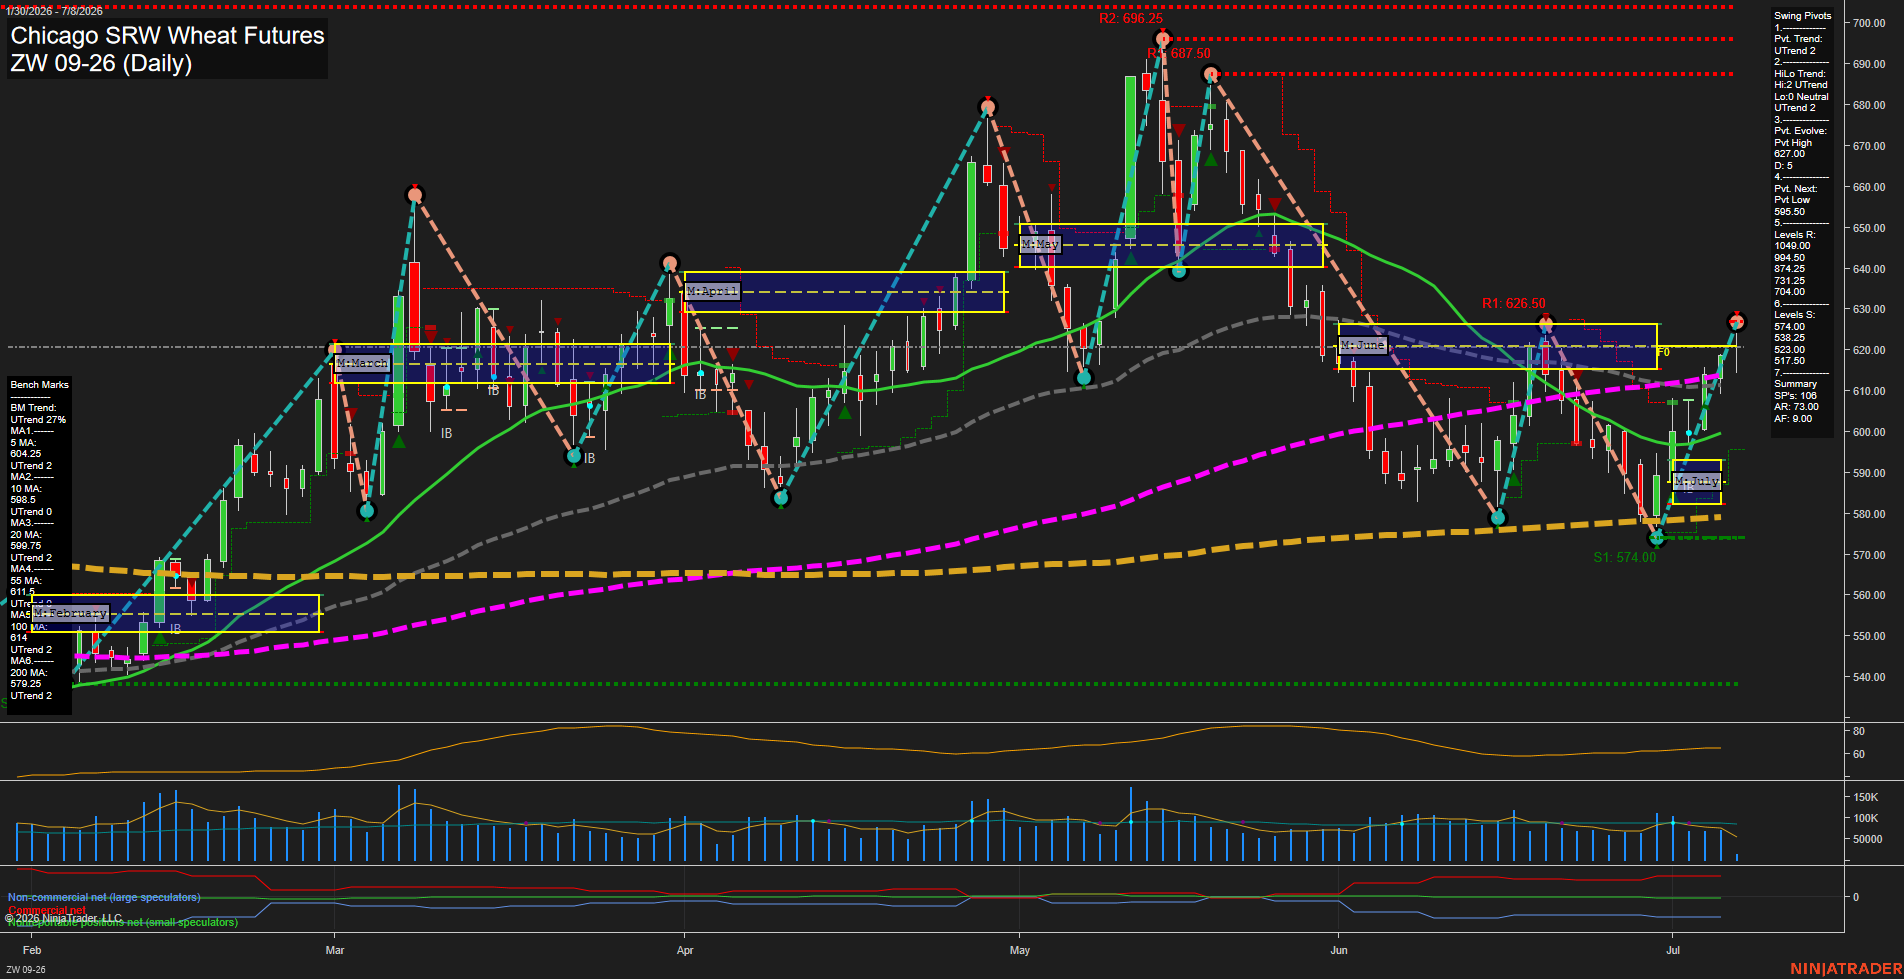
ZW Chicago SRW Wheat Futures Daily Chart Analysis: 2026-Jul-08 07:09 CT
Price Action
- Last: 620.00,
- Bars: Large,
- Mom: average.
WSFG Weekly
- Short-Term
- WSFG Current: 58%
- F0%/NTZ' Bias: Price Above,
- WSFG Trend: Up.
MSFG Month Jul
- Intermediate-Term
- MSFG Current: 33%
- F0%/NTZ' Bias: Price Above,
- MSFG Trend: Up.
YSFG Year 2026
- Long-Term
- YSFG Current: 36%
- F0%/NTZ' Bias: Price Above,
- YSFG Trend: Up.
Swing Pivots
- (Short-Term) 1. Pvt. Trend: UTrend,
- (Intermediate-Term) 2. HiLo Trend: UTrend,
- 3. Pvt. Evolve: Pvt High 627.00,
- 4. Pvt. Next: Pvt Low 595.50,
- 5. Levels R: 1049.00, 994.50, 874.25, 731.25, 704.00,
- 6. Levels S: 574.00, 538.25, 523.00, 517.50.
Daily Benchmarks
- (Short-Term) 5 Day: 604.25 Up Trend,
- (Short-Term) 10 Day: 598.50 Up Trend,
- (Intermediate-Term) 20 Day: 599.75 Up Trend,
- (Intermediate-Term) 55 Day: 611.50 Up Trend,
- (Long-Term) 100 Day: 614.00 Up Trend,
- (Long-Term) 200 Day: 579.25 Up Trend.
Additional Metrics
Recent Trade Signals
- 07 Jul 2026: Long ZW 09-26 @ 614.75 Signals.USAR.TR720
- 06 Jul 2026: Long ZW 09-26 @ 606.5 Signals.USAR-MSFG
- 06 Jul 2026: Long ZW 09-26 @ 604.5 Signals.USAR-WSFG
- 01 Jul 2026: Long ZW 09-26 @ 593.5 Signals.USAR.TR120
Overall Rating
- Short-Term: Bullish,
- Intermediate-Term: Bullish,
- Long-Term: Bullish.
Key Insights Summary
Wheat remains in a constructive swing structure with the daily pivot trend and HiLo trend both aligned upward, while price is holding above the weekly, monthly, and yearly fib grid bias levels. The chart shows a strong rally off the July low back toward the 620 area, following a sharp rebound from the 574 support zone and a reclaim of the clustered short- and intermediate-term benchmarks. The current setup reflects a bullish recovery inside a broader uptrend, with prior swing highs at 627 and 687.50 marking nearby reference points, while the benchmark stack stays supportive overall despite the recent pullback from the upper swing range. Volume and ATR indicate active participation and continued movement, but the price is still working through a choppy retracement phase after a fast advance, making the structure more of a bullish continuation-and-recovery profile than a clean one-way trend.
Chart Analysis ATS AI Generated: 2026-07-08 07:09 for Informational use only, not trading advice. Terms and Risk Disclosure Copyright © 2026. Algo Trading Systems LLC.