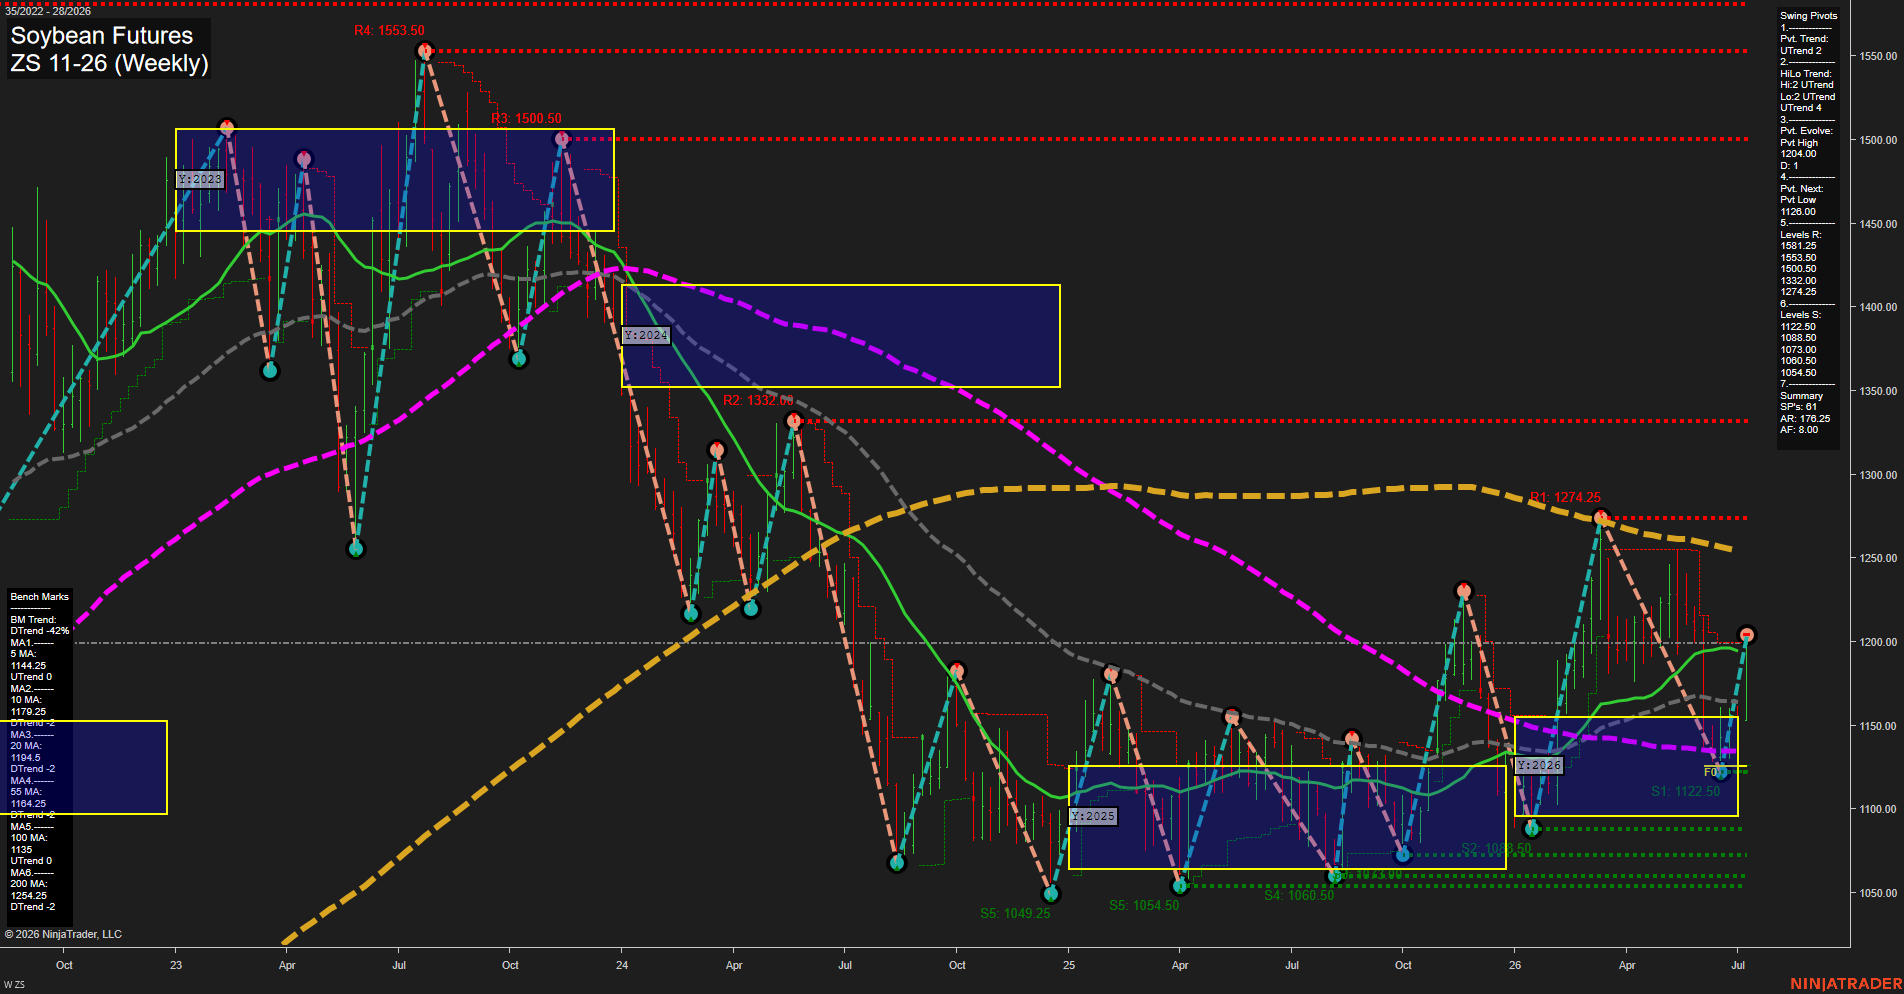
ZS Soybean Futures Weekly Chart Analysis: 2026-Jul-08 07:09 CT
Price Action
- Last: 1207.00,
- Bars: Medium,
- Mom: Average.
WSFG Weekly
- Short-Term
- WSFG Current: 150%
- F0%/NTZ' Bias: Price Above,
- WSFG Trend: Up.
MSFG Month Jul
- Intermediate-Term
- MSFG Current: 68%
- F0%/NTZ' Bias: Price Above,
- MSFG Trend: Up.
YSFG Year 2026
- Long-Term
- YSFG Current: 25%
- F0%/NTZ' Bias: Price Above,
- YSFG Trend: Up.
Swing Pivots
- (Short-Term) 1. Pvt. Trend: UTrend,
- (Intermediate-Term) 2. HiLo Trend: UTrend,
- 3. Pvt. Evolve: Pvt High 1204.00,
- 4. Pvt. Next: Pvt Low 1126.00,
- 5. Levels R: 1581.25, 1553.50, 1500.50, 1332.00, 1274.25,
- 6. Levels S: 1122.50, 1088.50, 1073.00, 1060.50, 1054.50.
Weekly Benchmarks
- (Short-Term) 5 Day: 1144.25 Up Trend,
- (Short-Term) 10 Day: 1179.25 Down Trend,
- (Intermediate-Term) 20 Day: 1194.50 Down Trend,
- (Intermediate-Term) 55 Day: 1164.25 Down Trend,
- (Long-Term) 100 Day: 1135.00 Up Trend,
- (Long-Term) 200 Day: 1254.25 Down Trend.
Recent Trade Signals
- 01 Jul 2026: Long ZS 11-26 @ 1159 Signals.USAR-MSFG
- 01 Jul 2026: Long ZS 11-26 @ 1147.75 Signals.USAR.TR120
Overall Rating
- Short-Term: Bullish,
- Intermediate-Term: Neutral,
- Long-Term: Neutral.
Key Insights Summary
Soybean futures are holding a constructive weekly recovery after a deep 2024-2025 decline, with price reclaiming the upper part of the 2026 yearly fib structure and pressing above the 20-day and 55-day neighborhood. The weekly session fib grid remains firmly above F0%, and the swing pivot structure is still in UTrend, showing that the latest rebound is part of a broader recovery sequence rather than a failed bounce. Near-term action is working through a choppy consolidation band around the 1200-1250 area, where prior pivot highs and benchmark averages are clustered. The longer-term backdrop is still mixed because the 200-day benchmark remains above price and the larger trend history still shows overhead supply from the 1274-1332 zone before any test of the major 1500+ resistance region. Recent long signals align with the improving short-term structure, while the intermediate and long-term picture remains more transitionary than directional.
Chart Analysis ATS AI Generated: 2026-07-08 07:09 for Informational use only, not trading advice. Terms and Risk Disclosure Copyright © 2026. Algo Trading Systems LLC.