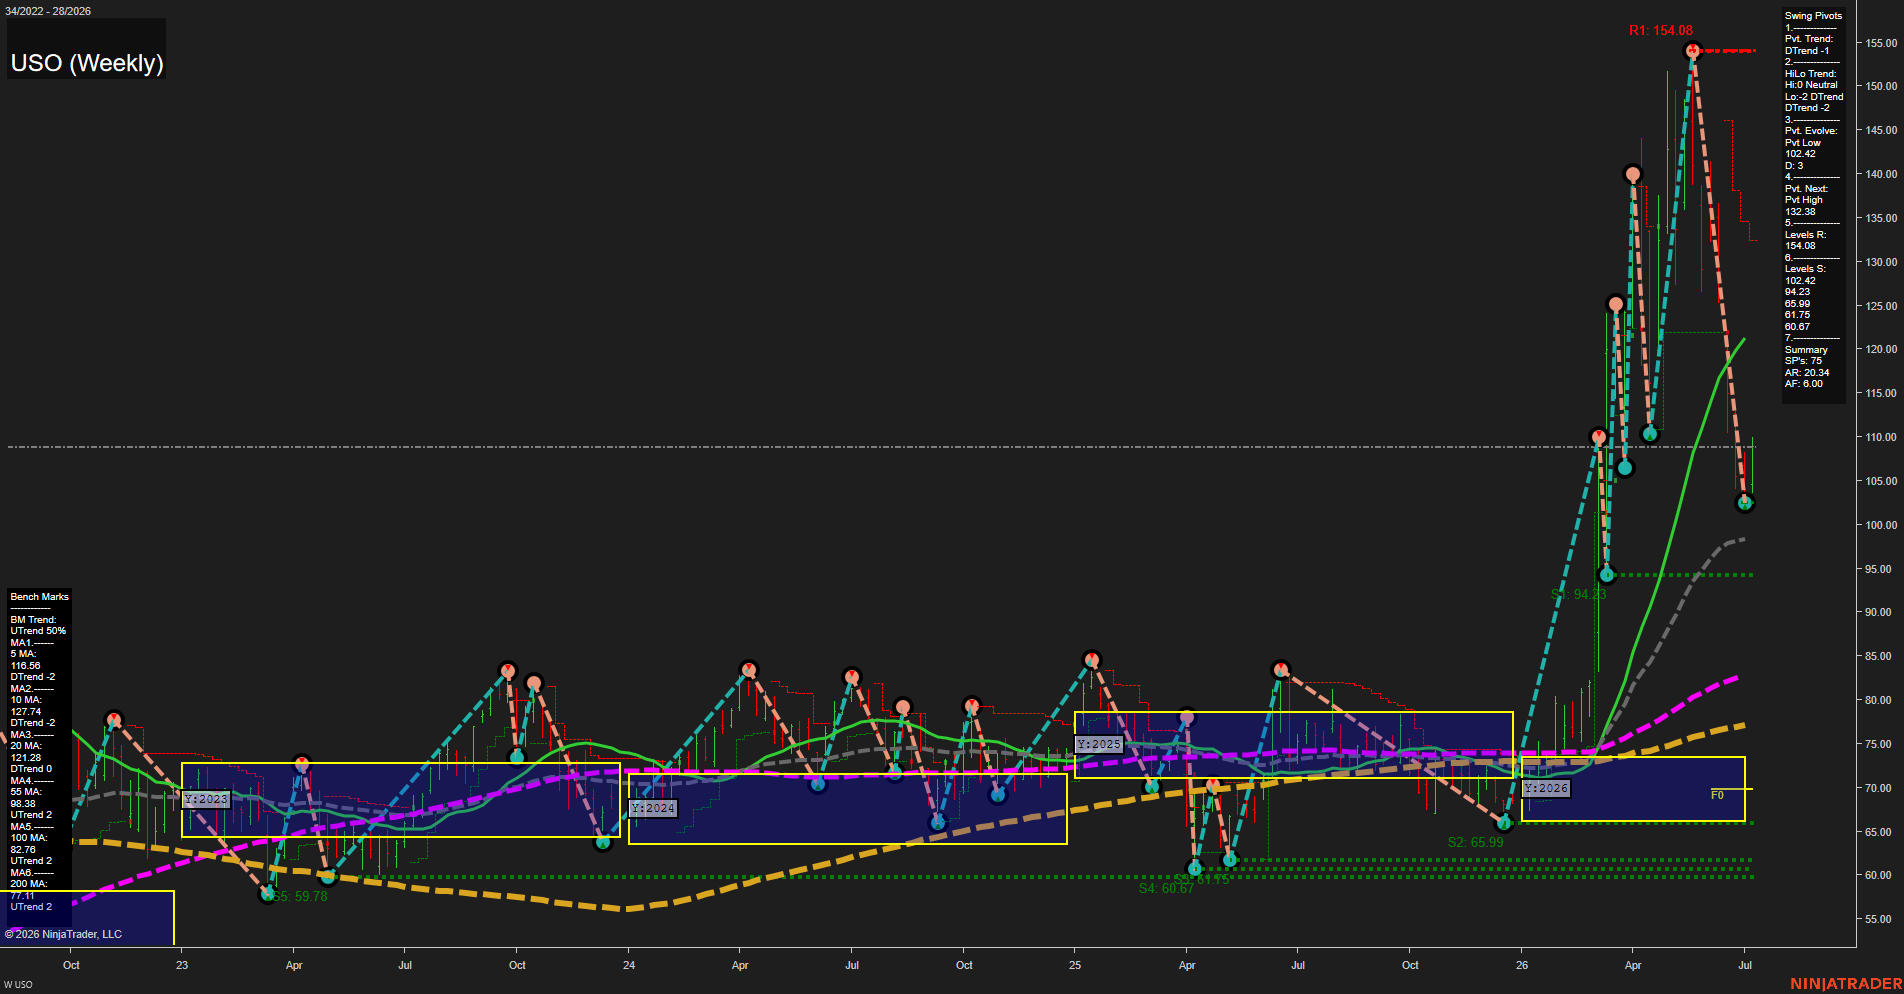
USO United States Oil Fund LP Weekly Chart Analysis: 2026-Jul-08 07:07 CT
Price Action
- Last: 103.00,
- Bars: Large,
- Mom: fast.
WSFG Weekly
- Short-Term
- WSFG Current: NA%
- F0%/NTZ' Bias: Price Neutral,
- WSFG Trend: Neutral.
MSFG Month Jul
- Intermediate-Term
- MSFG Current: NA%
- F0%/NTZ' Bias: Price Neutral,
- MSFG Trend: Neutral.
YSFG Year 2026
- Long-Term
- YSFG Current: NA%
- F0%/NTZ' Bias: Price Neutral,
- YSFG Trend: Neutral.
Swing Pivots
- (Short-Term) 1. Pvt. Trend: DTrend,
- (Intermediate-Term) 2. HiLo Trend: DTrend,
- 3. Pvt. Evolve: Pvt Low 102.42,
- 4. Pvt. Next: Pvt High 132.38,
- 5. Levels R: 154.08,
- 6. Levels S: 102.42, 94.23, 65.99, 61.75, 60.67.
Weekly Benchmarks
- (Short-Term) 5 Day: 116.56 Down Trend,
- (Short-Term) 10 Day: 127.74 Down Trend,
- (Intermediate-Term) 20 Day: 121.28 Down Trend,
- (Intermediate-Term) 55 Day: 98.38 Up Trend,
- (Long-Term) 100 Day: 82.76 Up Trend,
- (Long-Term) 200 Day: 77.11 Up Trend.
Overall Rating
- Short-Term: Bearish,
- Intermediate-Term: Neutral,
- Long-Term: Bullish.
Key Insights Summary
USO is digesting a very large weekly range after a vertical advance to the 154.08 resistance zone and a sharp retracement back toward the 102.42 pivot low. The short-term structure is bearish with the pivot trend in DTrend and price below the 5, 10, and 20 day benchmarks, which keeps the weekly tone in corrective mode. Intermediate-term conditions are mixed to neutral because the pullback is occurring after an extended impulse and price remains above the rising 55, 100, and 200 day benchmarks, preserving the broader recovery structure. Long-term tone stays bullish as the major moving averages continue to slope higher and the yearly fib framework remains centered in a broad expansion phase, even though the latest swing is a fast countertrend decline from an overextended peak.
Chart Analysis ATS AI Generated: 2026-07-08 07:08 for Informational use only, not trading advice. Terms and Risk Disclosure Copyright © 2026. Algo Trading Systems LLC.