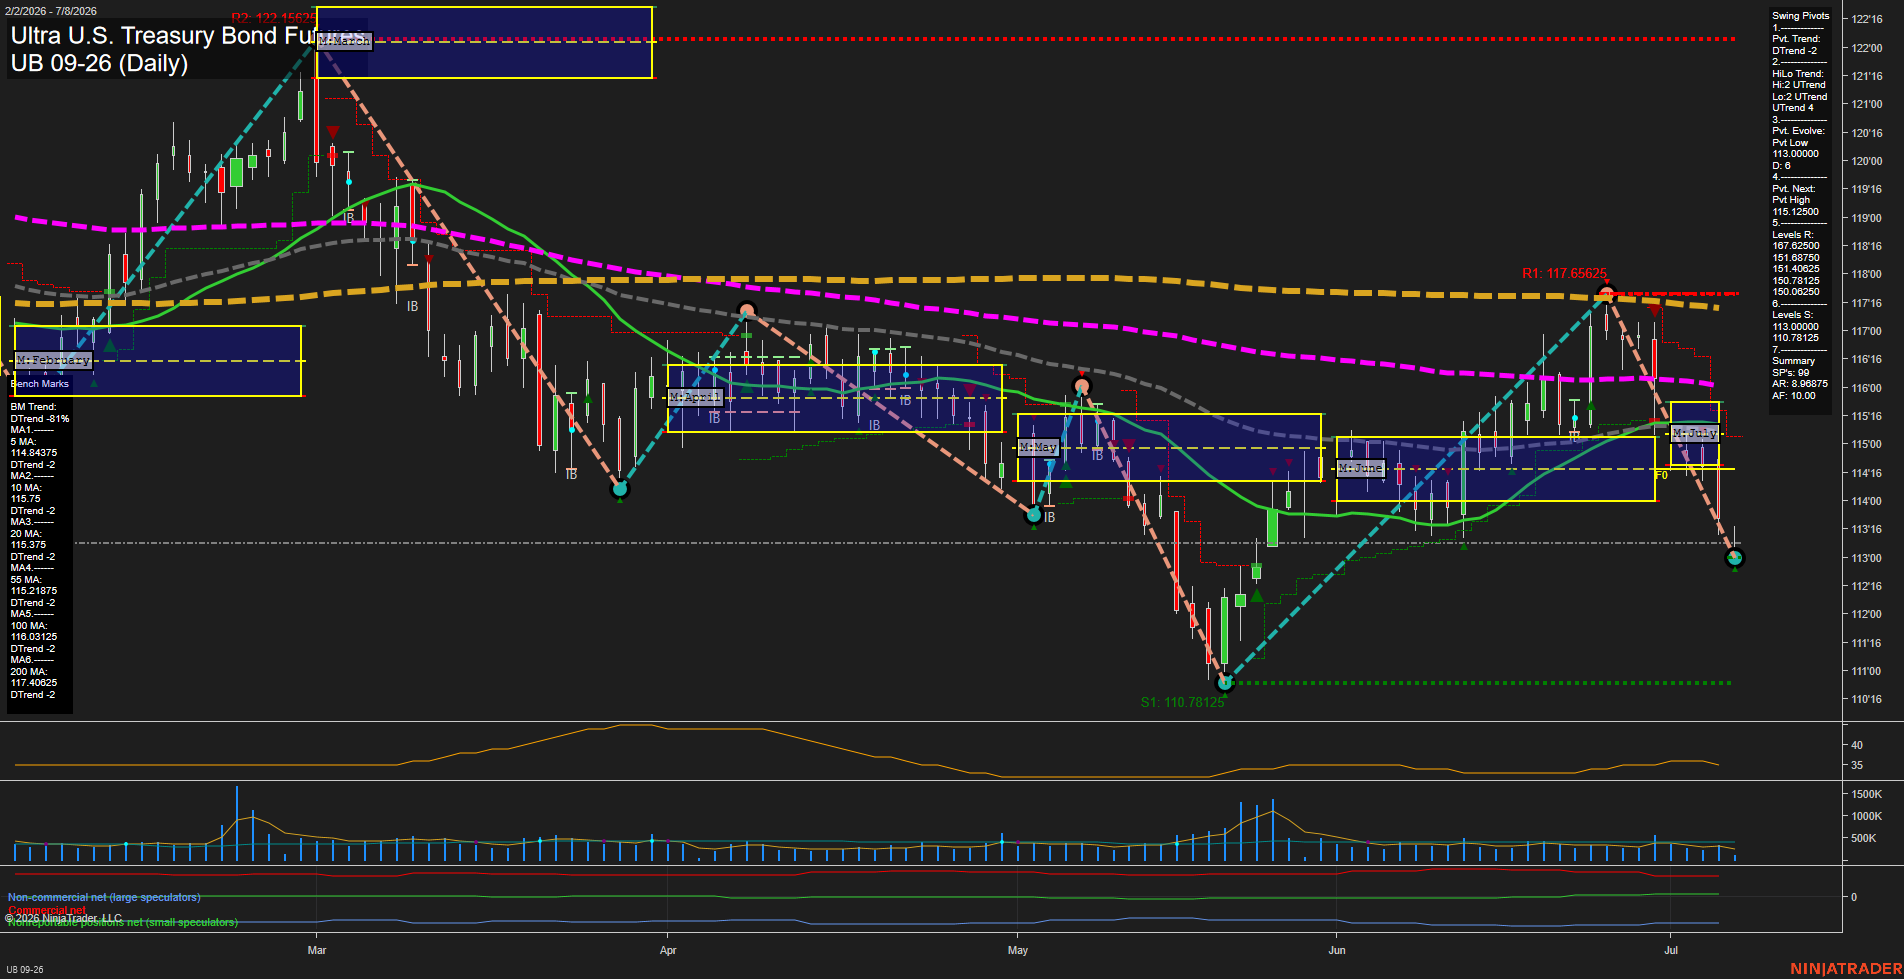
UB Ultra U.S. Treasury Bond Futures Daily Chart Analysis: 2026-Jul-08 07:07 CT
Price Action
- Last: 113.00,
- Bars: Large,
- Mom: fast.
WSFG Weekly
- Short-Term
- WSFG Current: -59%
- F0%/NTZ' Bias: Price Below,
- WSFG Trend: Down.
MSFG Month Jul
- Intermediate-Term
- MSFG Current: -41%
- F0%/NTZ' Bias: Price Below,
- MSFG Trend: Down.
YSFG Year 2026
- Long-Term
- YSFG Current: -12%
- F0%/NTZ' Bias: Price Below,
- YSFG Trend: Down.
Swing Pivots
- (Short-Term) 1. Pvt. Trend: DTrend,
- (Intermediate-Term) 2. HiLo Trend: UTrend,
- 3. Pvt. Evolve: Pvt Low 113.00000,
- 4. Pvt. Next: Pvt High 115.12500,
- 5. Levels R: 167.62500, 151.68750, 151.40625, 150.78125, 150.06250,
- 6. Levels S: 113.00000, 110.78125.
Daily Benchmarks
- (Short-Term) 5 Day: 114.84375 Down Trend,
- (Short-Term) 10 Day: 115.75000 Down Trend,
- (Intermediate-Term) 20 Day: 115.37500 Down Trend,
- (Intermediate-Term) 55 Day: 115.21875 Down Trend,
- (Long-Term) 100 Day: 116.03125 Down Trend,
- (Long-Term) 200 Day: 117.40625 Down Trend.
Additional Metrics
Recent Trade Signals
- 07 Jul 2026: Short UB 09-26 @ 114.21875 Signals.USAR-MSFG
- 07 Jul 2026: Short UB 09-26 @ 114.21875 Signals.USAR-WSFG
- 30 Jun 2026: Short UB 09-26 @ 116.21875 Signals.USAR.TR120
Overall Rating
- Short-Term: Bearish,
- Intermediate-Term: Bearish,
- Long-Term: Bearish.
Key Insights Summary
Price is pressing lower with a fast downside momentum reading and a large daily range, reflecting active trend continuation rather than a quiet consolidation. The weekly, monthly, and yearly session fib grids all sit below F0%, keeping the broader bias aligned to the downside. Swing structure confirms a short-term down pivot trend, while the intermediate HiLo structure remains higher than the immediate pivot state but still aligned with a softer, rollover posture after the prior rebound failed near the upper resistance band. All benchmark moving averages are stacked in a bearish sequence with price below the 5, 10, 20, 55, 100, and 200 day references, reinforcing a bearish trend across all time horizons. The latest trade signals also favor the downside, matching the current rejection from the recent rally and the return toward the lower pivot support area near 113.00000 and 110.78125.
Chart Analysis ATS AI Generated: 2026-07-08 07:07 for Informational use only, not trading advice. Terms and Risk Disclosure Copyright © 2026. Algo Trading Systems LLC.