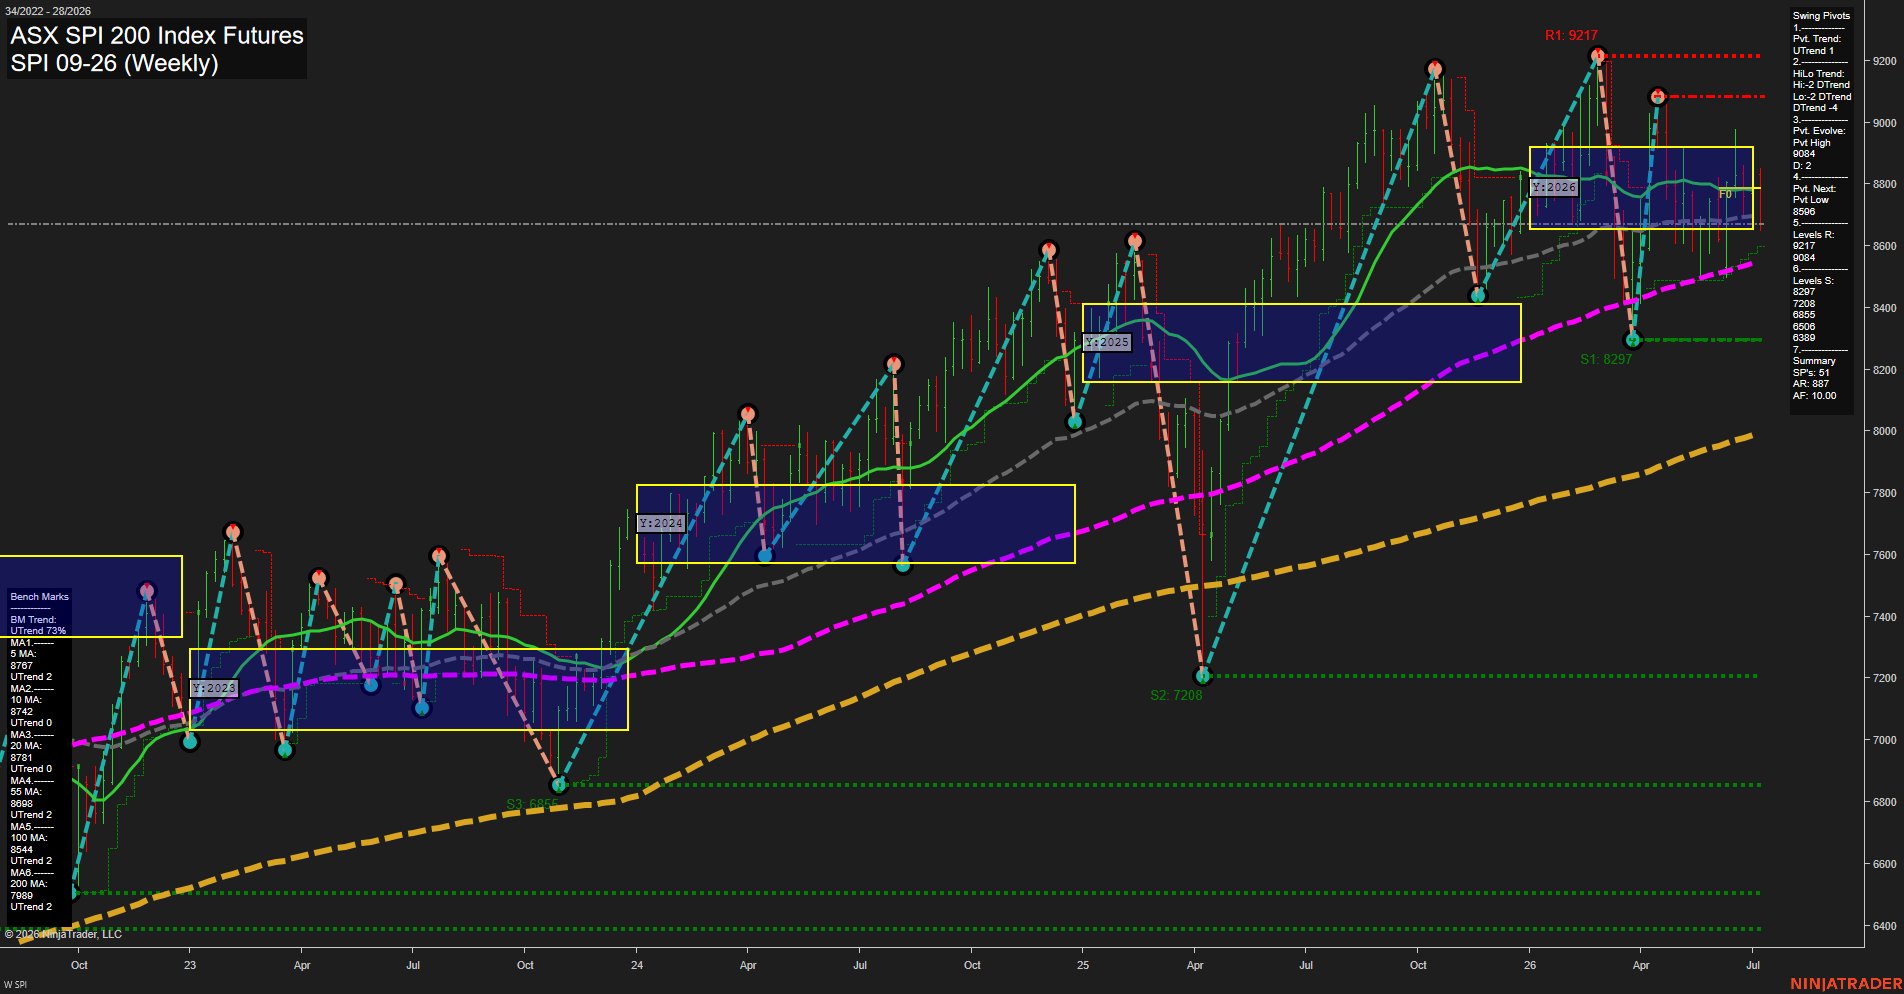
SPI ASX SPI 200 Index Futures Weekly Chart Analysis: 2026-Jul-08 07:07 CT
Price Action
- Last: 8767,
- Bars: Large,
- Mom: average.
WSFG Weekly
- Short-Term
- WSFG Current: NA%
- F0%/NTZ' Bias: Price Neutral,
- WSFG Trend: Neutral.
MSFG Month Jul
- Intermediate-Term
- MSFG Current: NA%
- F0%/NTZ' Bias: Price Neutral,
- MSFG Trend: Neutral.
YSFG Year 2026
- Long-Term
- YSFG Current: NA%
- F0%/NTZ' Bias: Price Neutral,
- YSFG Trend: Neutral.
Swing Pivots
- (Short-Term) 1. Pvt. Trend: UTrend,
- (Intermediate-Term) 2. HiLo Trend: DTrend,
- 3. Pvt. Evolve: Pvt High 9084,
- 4. Pvt. Next: Pvt Low 8596,
- 5. Levels R: 9217, 9084,
- 6. Levels S: 8297, 7208, 6855, 6506, 6389.
Weekly Benchmarks
- (Short-Term) 5 Day: 8767 Up Trend,
- (Short-Term) 10 Day: 8742 Up Trend,
- (Intermediate-Term) 20 Day: 8781 Up Trend,
- (Intermediate-Term) 55 Day: 8898 Up Trend,
- (Long-Term) 100 Day: 8544 Up Trend,
- (Long-Term) 200 Day: 7808 Up Trend.
Overall Rating
- Short-Term: Neutral,
- Intermediate-Term: Neutral,
- Long-Term: Bullish.
Key Insights Summary
Weekly structure shows the SPI 200 holding a broad multi-year uptrend, but the most recent swing sequence is mixed after a sharp rally to the 9200 area and a rapid rejection back toward the upper-8700s. Price is sitting below the latest swing resistance band yet still well above the deeper yearly support zones, leaving the tape in a consolidation-to-pullback phase rather than a clean trend breakout. The pivot map still carries a higher-timeframe bullish backdrop, but the current intermediate swing trend has rolled over, with the market now working off the prior high near 9084 and watching the 8596 swing-low pivot as the next structural reference. Benchmarks remain broadly supportive on the higher timeframe, with the long-term moving averages trending higher, even though price is moving inside a choppy range beneath the nearer-term averages. Overall, the chart reads as an established long-term advance that has entered a corrective weekly rhythm, with alternating rallies and selloffs around the Yearly Session Fib bands and prior pivot levels.
Chart Analysis ATS AI Generated: 2026-07-08 07:07 for Informational use only, not trading advice. Terms and Risk Disclosure Copyright © 2026. Algo Trading Systems LLC.