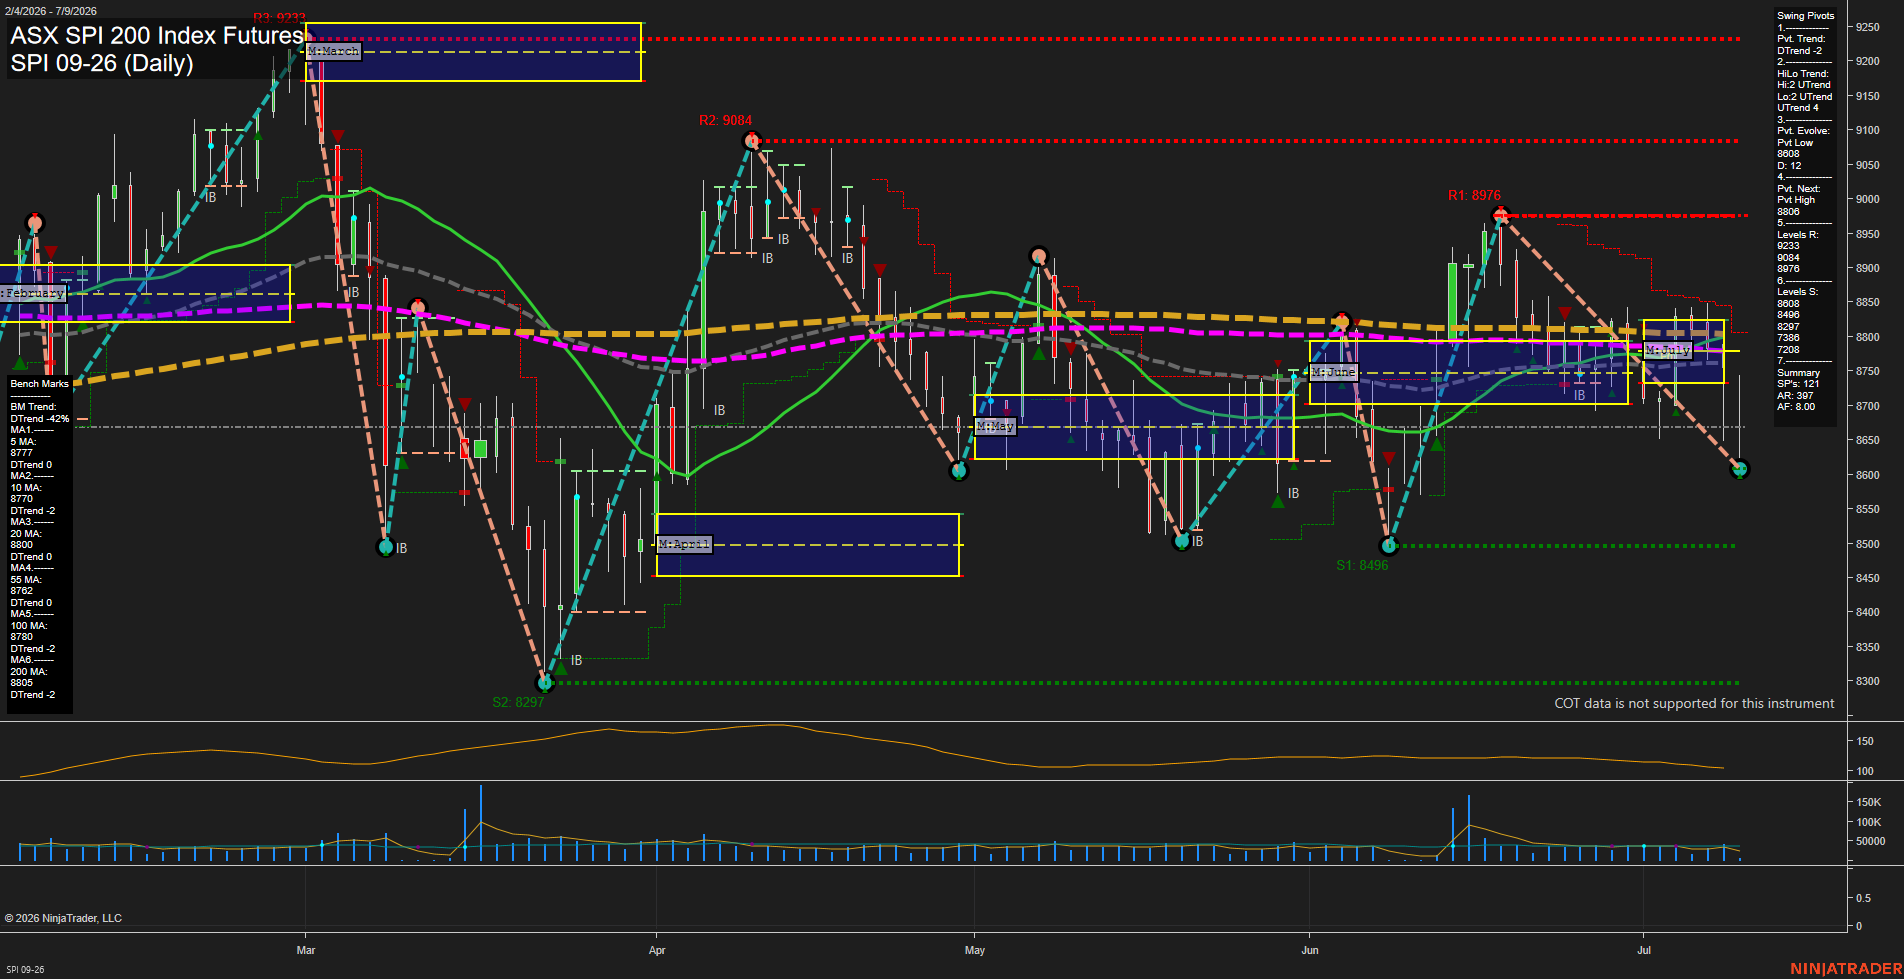
SPI ASX SPI 200 Index Futures Daily Chart Analysis: 2026-Jul-08 07:06 CT
Price Action
- Last: 8770,
- Bars: Medium,
- Mom: slow.
WSFG Weekly
- Short-Term
- WSFG Current: NA%
- F0%/NTZ' Bias: Price Neutral,
- WSFG Trend: Neutral.
MSFG Month Jul
- Intermediate-Term
- MSFG Current: NA%
- F0%/NTZ' Bias: Price Neutral,
- MSFG Trend: Neutral.
YSFG Year 2026
- Long-Term
- YSFG Current: NA%
- F0%/NTZ' Bias: Price Neutral,
- YSFG Trend: Neutral.
Swing Pivots
- (Short-Term) 1. Pvt. Trend: DTrend,
- (Intermediate-Term) 2. HiLo Trend: UTrend,
- 3. Pvt. Evolve: Pvt low 8608,
- 4. Pvt. Next: Pvt low 8608,
- 5. Levels R: 9233, 9084, 8976,
- 6. Levels S: 8608, 8496, 8297, 7388, 7208.
Daily Benchmarks
- (Short-Term) 5 Day: 8777 Down Trend,
- (Short-Term) 10 Day: 8770 Down Trend,
- (Intermediate-Term) 20 Day: 8800 Up Trend,
- (Intermediate-Term) 55 Day: 8762 Down Trend,
- (Long-Term) 100 Day: 8780 Down Trend,
- (Long-Term) 200 Day: 8805 Down Trend.
Additional Metrics
Overall Rating
- Short-Term: Bearish,
- Intermediate-Term: Neutral,
- Long-Term: Bearish.
Key Insights Summary
The daily structure remains choppy and rotational, with price sitting near the middle of the recent range after repeated swings between the 8600 area and the upper 8900s. Short-term pivot trend is still DTrend, but the higher/lower pivot structure remains constructive enough to keep the intermediate read from turning outright bearish, especially with the HiLo trend still UTrend. Price is hovering around the cluster of benchmarks near 8760 to 8805, which shows a compressed decision zone rather than a clean trend extension. Resistance remains layered overhead at 8976, 9084, and 9233, while support steps down through 8608, 8496, and 8297. The 100-day and 200-day benchmarks are still trending lower, keeping the longer-term tone soft, while the 20-day remains the only clearly supportive intermediate reference. Volatility is moderate with ATR at 96 and volume running near normal, consistent with a range-bound, test-and-reject style market rather than a directional breakout phase.
Chart Analysis ATS AI Generated: 2026-07-08 07:07 for Informational use only, not trading advice. Terms and Risk Disclosure Copyright © 2026. Algo Trading Systems LLC.