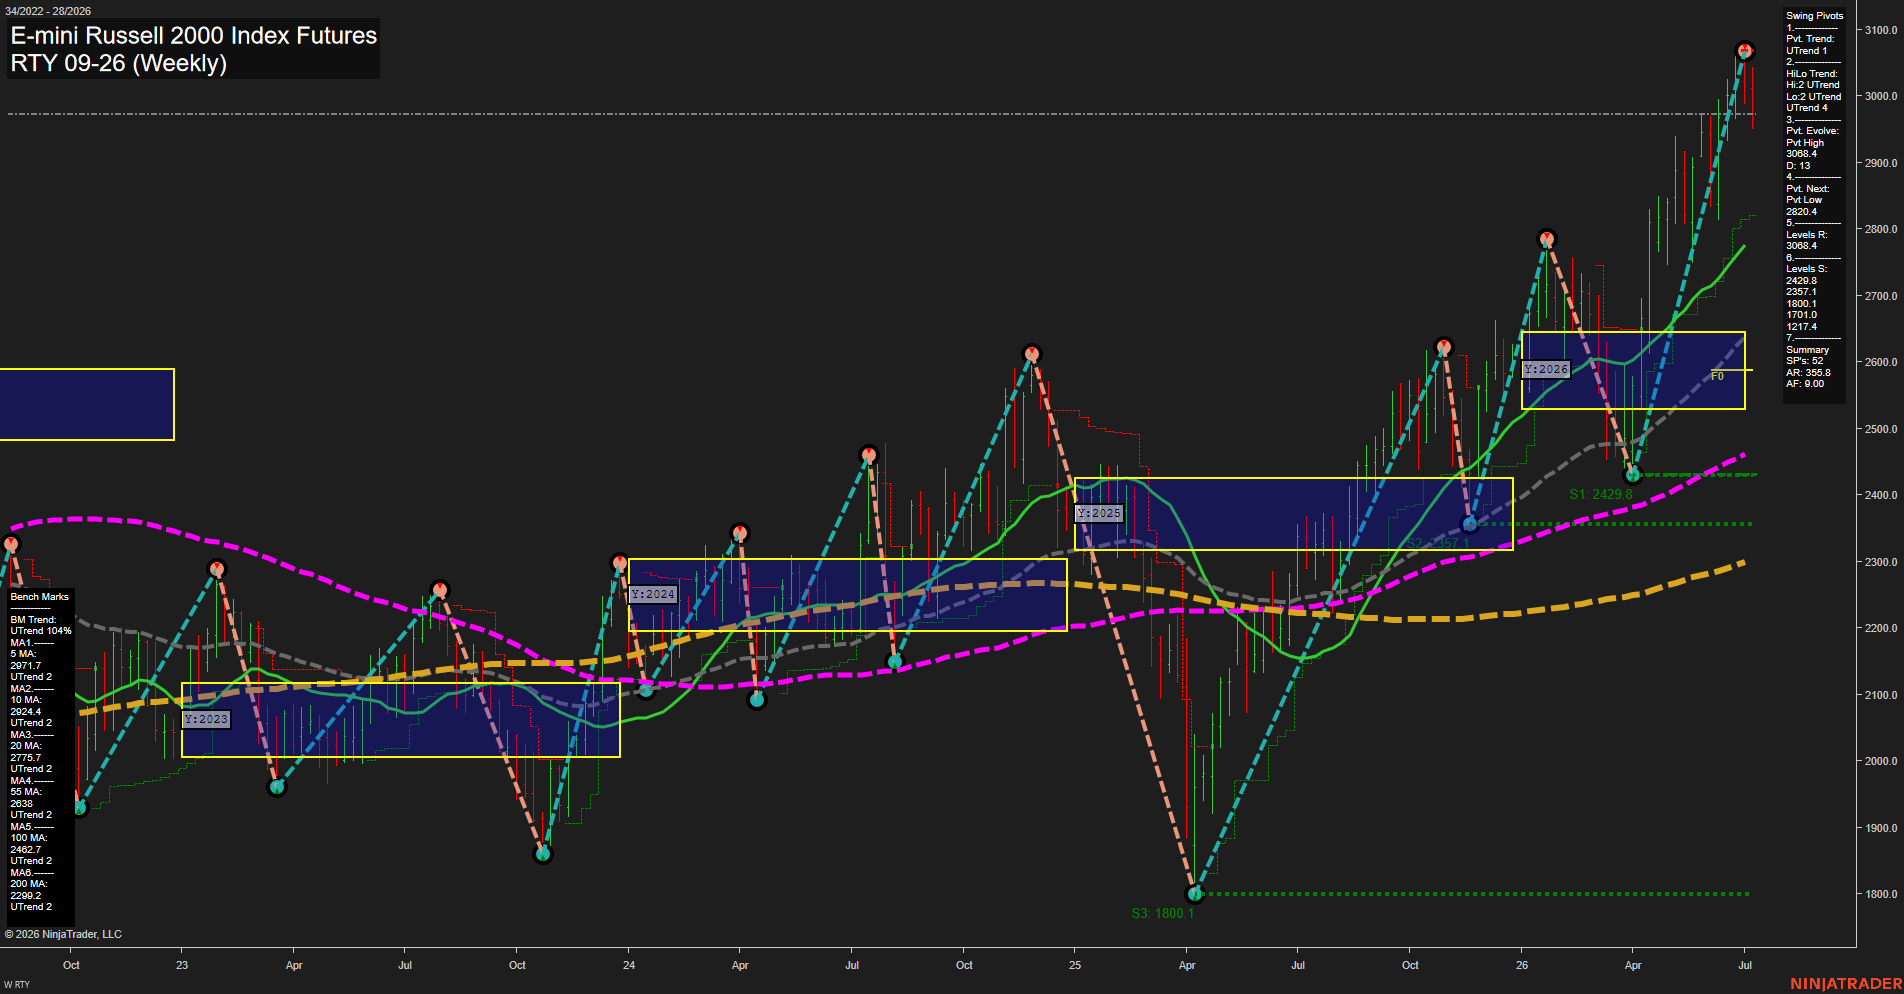
RTY E-mini Russell 2000 Index Futures Weekly Chart Analysis: 2026-Jul-08 07:06 CT
Price Action
- Last: 3060.0,
- Bars: Large,
- Mom: Fast.
WSFG Weekly
- Short-Term
- WSFG Current: -41%
- F0%/NTZ' Bias: Price Below,
- WSFG Trend: Down.
MSFG Month Jul
- Intermediate-Term
- MSFG Current: -23%
- F0%/NTZ' Bias: Price Below,
- MSFG Trend: Down.
YSFG Year 2026
- Long-Term
- YSFG Current: 67%
- F0%/NTZ' Bias: Price Above,
- YSFG Trend: Up.
Swing Pivots
- (Short-Term) 1. Pvt. Trend: UTrend,
- (Intermediate-Term) 2. HiLo Trend: UTrend,
- 3. Pvt. Evolve: Pvt High 3068.4,
- 4. Pvt. Next: Pvt Low 2820.4,
- 5. Levels R: 3068.4,
- 6. Levels S: 2429.8, 2357.1, 1800.1, 1701.0, 1217.4.
Weekly Benchmarks
- (Short-Term) 5 Day: 2971.7 Up Trend,
- (Short-Term) 10 Day: 2924.4 Up Trend,
- (Intermediate-Term) 20 Day: 2775.7 Up Trend,
- (Intermediate-Term) 55 Day: 2638.0 Up Trend,
- (Long-Term) 100 Day: 2462.7 Up Trend,
- (Long-Term) 200 Day: 2289.2 Up Trend.
Recent Trade Signals
- 08 Jul 2026: Short RTY 09-26 @ 2993 Signals.USAR-MSFG
- 07 Jul 2026: Short RTY 09-26 @ 3007.4 Signals.USAR-WSFG
- 02 Jul 2026: Short RTY 09-26 @ 2991.2 Signals.USAR.TR120
Overall Rating
- Short-Term: Bearish,
- Intermediate-Term: Bearish,
- Long-Term: Bullish.
Key Insights Summary
RTY remains in a powerful long-term uptrend with all benchmark moving averages aligned higher and yearly structure still above the NTZ midpoint, but the weekly and monthly session fib grids are both below their center lines, keeping the shorter-cycle tone bearish. Price is pressing near the prior swing high area after a strong vertical rally, so the chart reflects extended momentum, large weekly bars, and a fast impulse phase rather than a balanced range. Swing pivot structure stays in UTrend, yet the next pivot reference is a lower swing low at 2820.4, showing that the market has already begun a short-term rotation against the latest surge. Recent short signals from the weekly and monthly session grids reinforce the current countertrend tone on the lower timeframes while the broader trend still points up.
Chart Analysis ATS AI Generated: 2026-07-08 07:06 for Informational use only, not trading advice. Terms and Risk Disclosure Copyright © 2026. Algo Trading Systems LLC.