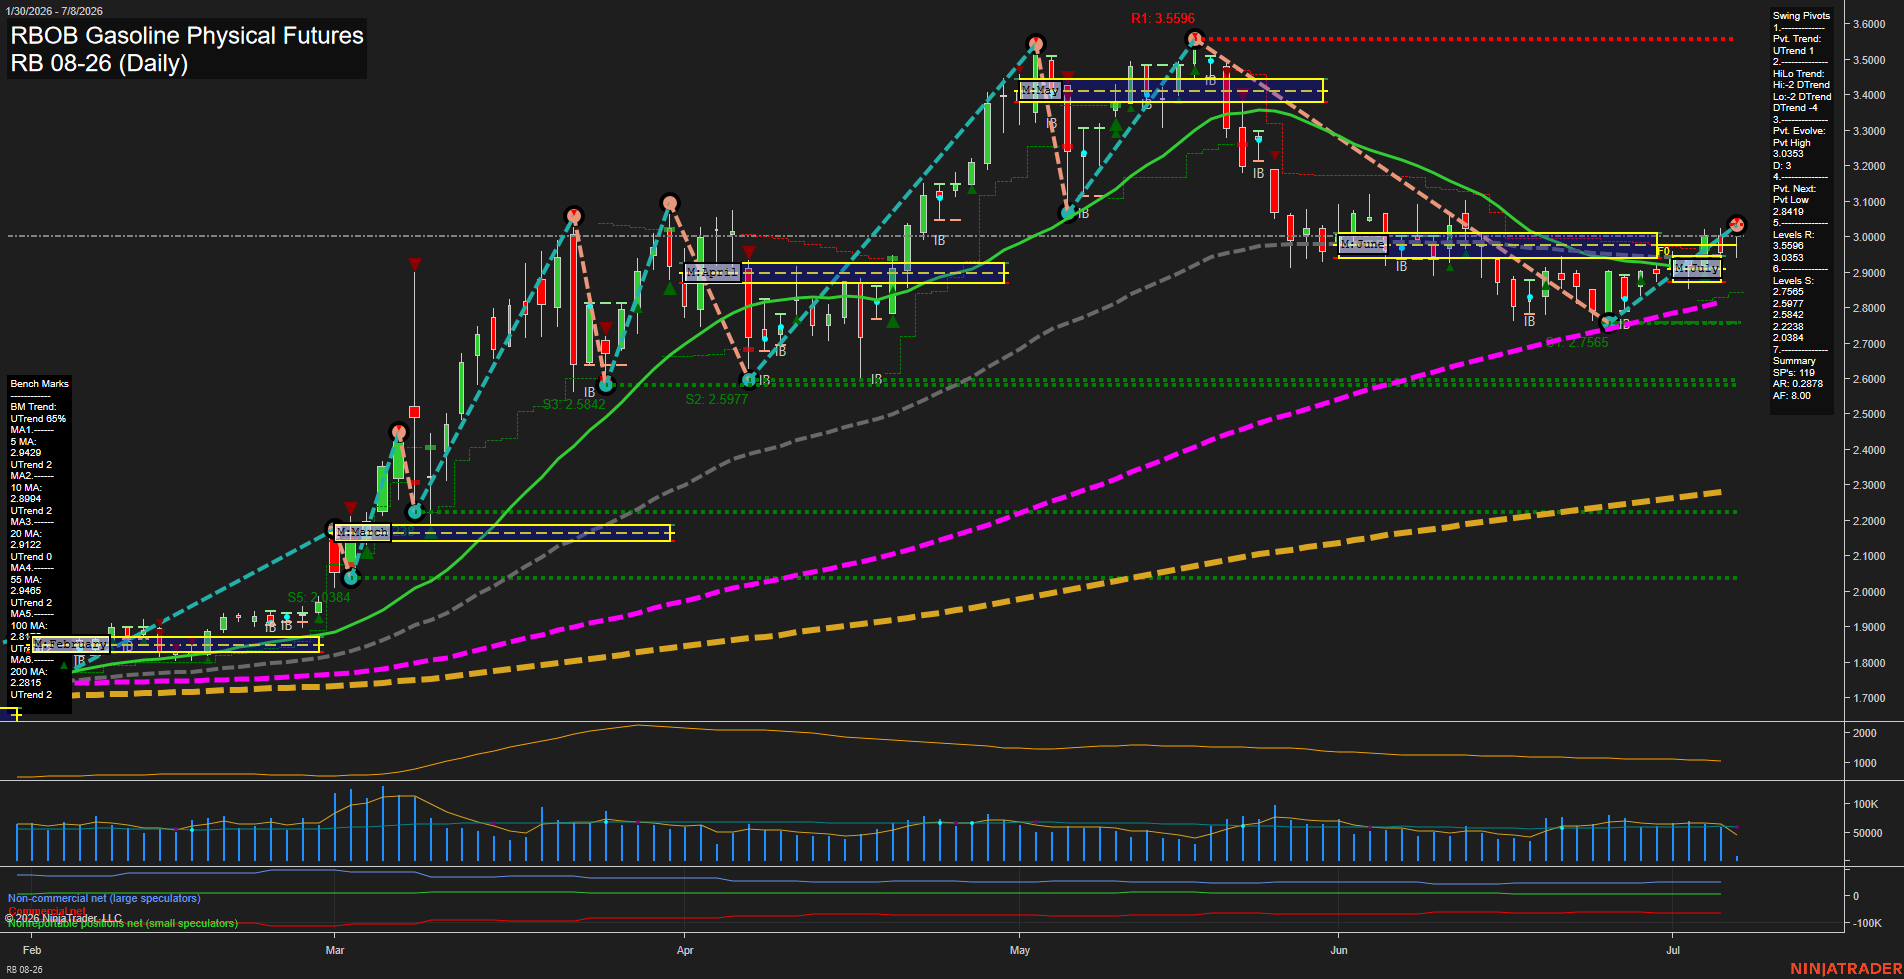
RB RBOB Gasoline Physical Futures Daily Chart Analysis: 2026-Jul-08 07:05 CT
Price Action
- Last: 2.9554,
- Bars: Medium,
- Mom: average.
WSFG Weekly
- Short-Term
- WSFG Current: 35%
- F0%/NTZ' Bias: Price Above,
- WSFG Trend: Up.
MSFG Month Jul
- Intermediate-Term
- MSFG Current: 12%
- F0%/NTZ' Bias: Price Above,
- MSFG Trend: Up.
YSFG Year 2026
- Long-Term
- YSFG Current: 135%
- F0%/NTZ' Bias: Price Above,
- YSFG Trend: Up.
Swing Pivots
- (Short-Term) 1. Pvt. Trend: UTrend,
- (Intermediate-Term) 2. HiLo Trend: DTrend,
- 3. Pvt. Evolve: Pvt High 3.0353,
- 4. Pvt. Next: Pvt Low 2.8419,
- 5. Levels R: 3.5596, 3.0353,
- 6. Levels S: 2.7565, 2.5977, 2.5842, 2.2238, 2.0384.
Daily Benchmarks
- (Short-Term) 5 Day: 2.9429 Up Trend,
- (Short-Term) 10 Day: 2.8994 Up Trend,
- (Intermediate-Term) 20 Day: 2.9122 Up Trend,
- (Intermediate-Term) 55 Day: 2.9465 Up Trend,
- (Long-Term) 100 Day: 2.8173 Up Trend,
- (Long-Term) 200 Day: 2.2815 Up Trend.
Additional Metrics
Recent Trade Signals
- 07 Jul 2026: Short RB 08-26 @ 2.9554 Signals.USAR.TR120
- 07 Jul 2026: Long RB 08-26 @ 3.0038 Signals.USAR-MSFG
- 06 Jul 2026: Long RB 08-26 @ 2.9753 Signals.USAR-WSFG
Overall Rating
- Short-Term: Bullish,
- Intermediate-Term: Neutral,
- Long-Term: Bullish.
Key Insights Summary
RB gasoline futures remain in a broader uptrend despite the sharp retracement from the late-May/early-June peak near 3.5596. The daily structure is still holding above the 5, 10, 20, 55, 100, and 200-day benchmarks, which keeps the larger trend constructive, while the swing pivot framework shows a short-term UTrend but an intermediate HiLo DTrend, reflecting a market that has recently lost upside momentum and shifted into a corrective phase. Price is trading above the weekly, monthly, and yearly session fib biases, so the higher-timeframe structure remains aligned to the upside, but the nearby pivot levels and repeated inside-bar style compression around the 2.95 area show a choppy consolidation band beneath the recent high. The most relevant themes are a post-rally digestion, a lower-high sequence from the 3.03-3.56 zone, and a market that is trying to stabilize above the 2.84-2.76 support region while volume and ATR indicate active but not extreme participation.
Chart Analysis ATS AI Generated: 2026-07-08 07:06 for Informational use only, not trading advice. Terms and Risk Disclosure Copyright © 2026. Algo Trading Systems LLC.