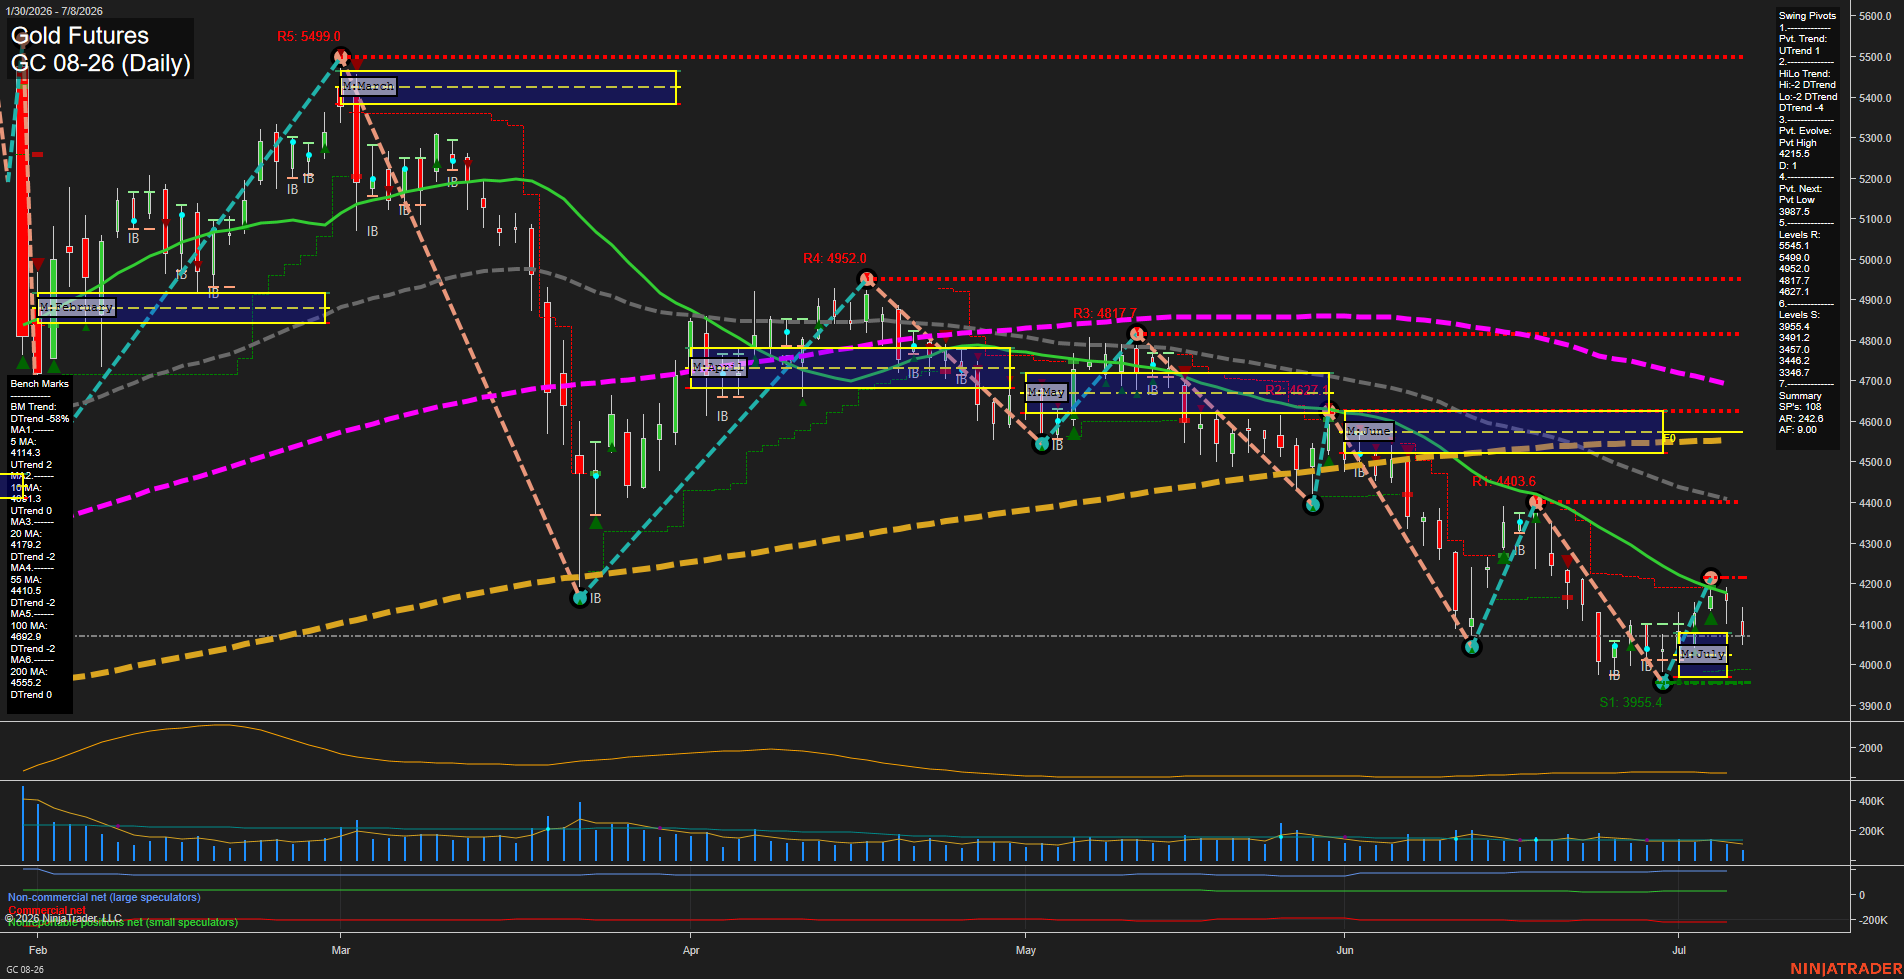
GC Gold Futures Daily Chart Analysis: 2026-Jul-08 07:03 CT
Price Action
- Last: 4034.8,
- Bars: Large,
- Mom: Fast.
WSFG Weekly
- Short-Term
- WSFG Current: -41%
- F0%/NTZ' Bias: Price Below,
- WSFG Trend: Down.
MSFG Month Jul
- Intermediate-Term
- MSFG Current: 12%
- F0%/NTZ' Bias: Price Above,
- MSFG Trend: Up.
YSFG Year 2026
- Long-Term
- YSFG Current: -116%
- F0%/NTZ' Bias: Price Below,
- YSFG Trend: Down.
Swing Pivots
- (Short-Term) 1. Pvt. Trend: UTrend,
- (Intermediate-Term) 2. HiLo Trend: DTrend,
- 3. Pvt. Evolve: Pvt High 4215.5,
- 4. Pvt. Next: Pvt Low 3997.5,
- 5. Levels R: 5545.1, 5499.0, 4952.0, 4817.7, 4627.1,
- 6. Levels S: 3955.4, 3491.2, 3457.0, 3446.2, 3434.4.
Daily Benchmarks
- (Short-Term) 5 Day: 4114.3 Up Trend,
- (Short-Term) 10 Day: 4051.3 Up Trend,
- (Intermediate-Term) 20 Day: 4179.2 Down Trend,
- (Intermediate-Term) 55 Day: 4410.5 Down Trend,
- (Long-Term) 100 Day: 4692.9 Down Trend,
- (Long-Term) 200 Day: 4555.2 Down Trend.
Additional Metrics
- ATR: 242.6,
- VOLMA: 182966.
Recent Trade Signals
- 08 Jul 2026: Short GC 08-26 @ 4134.4 Signals.USAR-WSFG
- 07 Jul 2026: Long GC 08-26 @ 4135.4 Signals.USAR-MSFG
- 01 Jul 2026: Long GC 08-26 @ 4095.5 Signals.USAR.TR120
Overall Rating
- Short-Term: Bearish,
- Intermediate-Term: Bearish,
- Long-Term: Bearish.
Key Insights Summary
Gold futures are in a broad corrective phase with heavy downside pressure from the daily moving-average stack and the intermediate/long-term pivot structure. Price is trading below the 5-day and 10-day benchmarks, while the 20-day, 55-day, 100-day, and 200-day benchmarks all lean lower, confirming a bearish daily framework. The weekly fib grid remains negative and below its F0% line, reinforcing short-term weakness, while the monthly fib grid is still positive and above F0%, reflecting a larger monthly countertrend uplift that has not yet translated into a sustained daily reversal. Swing structure is still anchored by a short-term up pivot, but the intermediate HiLo trend is down and the next pivot reference sits near 3997.5, with the 3955.4 support zone standing out as the nearest major support shelf. Recent signals show a sharp shift from the July 7 MSFG long to the July 8 WSFG short, matching the current selloff and the failed rebound from the early-July retracement. The tape is showing a lower-high, lower-low sequence with fast momentum and expanded daily range behavior, typical of a trending decline with intermittent bounce attempts.
Chart Analysis ATS AI Generated: 2026-07-08 07:04 for Informational use only, not trading advice. Terms and Risk Disclosure Copyright © 2026. Algo Trading Systems LLC.