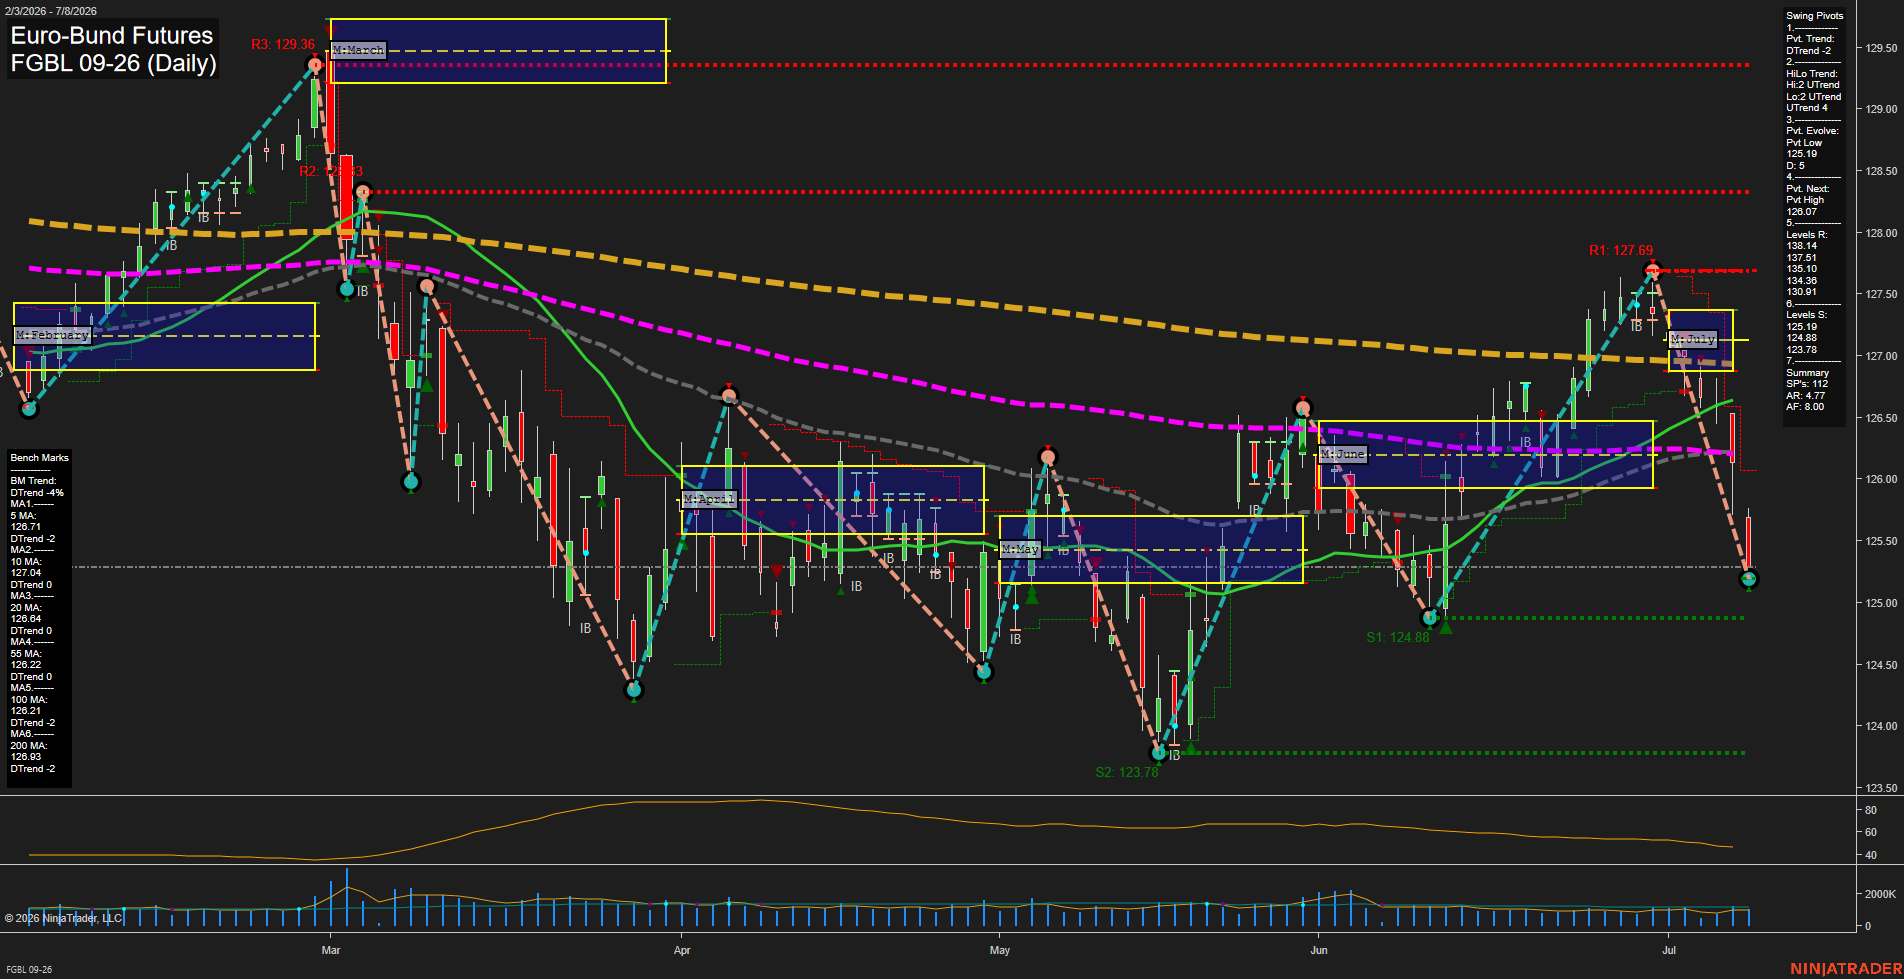
FGBL Euro-Bund Futures Daily Chart Analysis: 2026-Jul-08 07:03 CT
Price Action
- Last: 125.19,
- Bars: Large,
- Mom: Fast.
WSFG Weekly
- Short-Term
- WSFG Current: -111%
- F0%/NTZ' Bias: Price Below,
- WSFG Trend: Down.
MSFG Month Jul
- Intermediate-Term
- MSFG Current: -65%
- F0%/NTZ' Bias: Price Below,
- MSFG Trend: Down.
YSFG Year 2026
- Long-Term
- YSFG Current: -11%
- F0%/NTZ' Bias: Price Below,
- YSFG Trend: Down.
Swing Pivots
- (Short-Term) 1. Pvt. Trend: DTrend,
- (Intermediate-Term) 2. HiLo Trend: UTrend,
- 3. Pvt. Evolve: Pvt low 125.19,
- 4. Pvt. Next: Pvt high 126.07,
- 5. Levels R: 138.14, 137.51, 135.10, 134.38, 130.91, 126.07,
- 6. Levels S: 125.19, 124.88, 123.78.
Daily Benchmarks
- (Short-Term) 5 Day: 126.71 Down Trend,
- (Short-Term) 10 Day: 127.04 Down Trend,
- (Intermediate-Term) 20 Day: 126.84 Down Trend,
- (Intermediate-Term) 55 Day: 126.22 Down Trend,
- (Long-Term) 100 Day: 126.21 Down Trend,
- (Long-Term) 200 Day: 126.93 Down Trend.
Additional Metrics
Recent Trade Signals
- 07 Jul 2026: Short FGBL 09-26 @ 126.37 Signals.USAR-WSFG
- 06 Jul 2026: Short FGBL 09-26 @ 126.5 Signals.USAR.TR720
- 06 Jul 2026: Short FGBL 09-26 @ 126.61 Signals.USAR-MSFG
Overall Rating
- Short-Term: Bearish,
- Intermediate-Term: Bearish,
- Long-Term: Bearish.
Key Insights Summary
Price action shows a sharp downside reversal from the early-July peak near 127.69, with the market now trading back down around 125.19 and pressing into the lower pivot structure. The daily tape is large and fast, matching the accelerated selloff visible after the recent rally failed at resistance and rolled over hard. Weekly, monthly, and year-to-date fib grids all remain below their NTZ/F0% centers, keeping the broader bias aligned to the downside. The pivot map now reflects a fresh lower low with the next upside reference at 126.07, while resistance is layered overhead through 126.91, 130.91, 134.38, and higher. Benchmarks are stacked in a down configuration across all major averages, confirming a bearish trend regime on short-, intermediate-, and long-term frames. The recent signal cluster also stays aligned with the short side, reinforcing that the latest move is part of a larger trend-continuation breakdown after the June advance failed to sustain above key resistance.
Chart Analysis ATS AI Generated: 2026-07-08 07:03 for Informational use only, not trading advice. Terms and Risk Disclosure Copyright © 2026. Algo Trading Systems LLC.