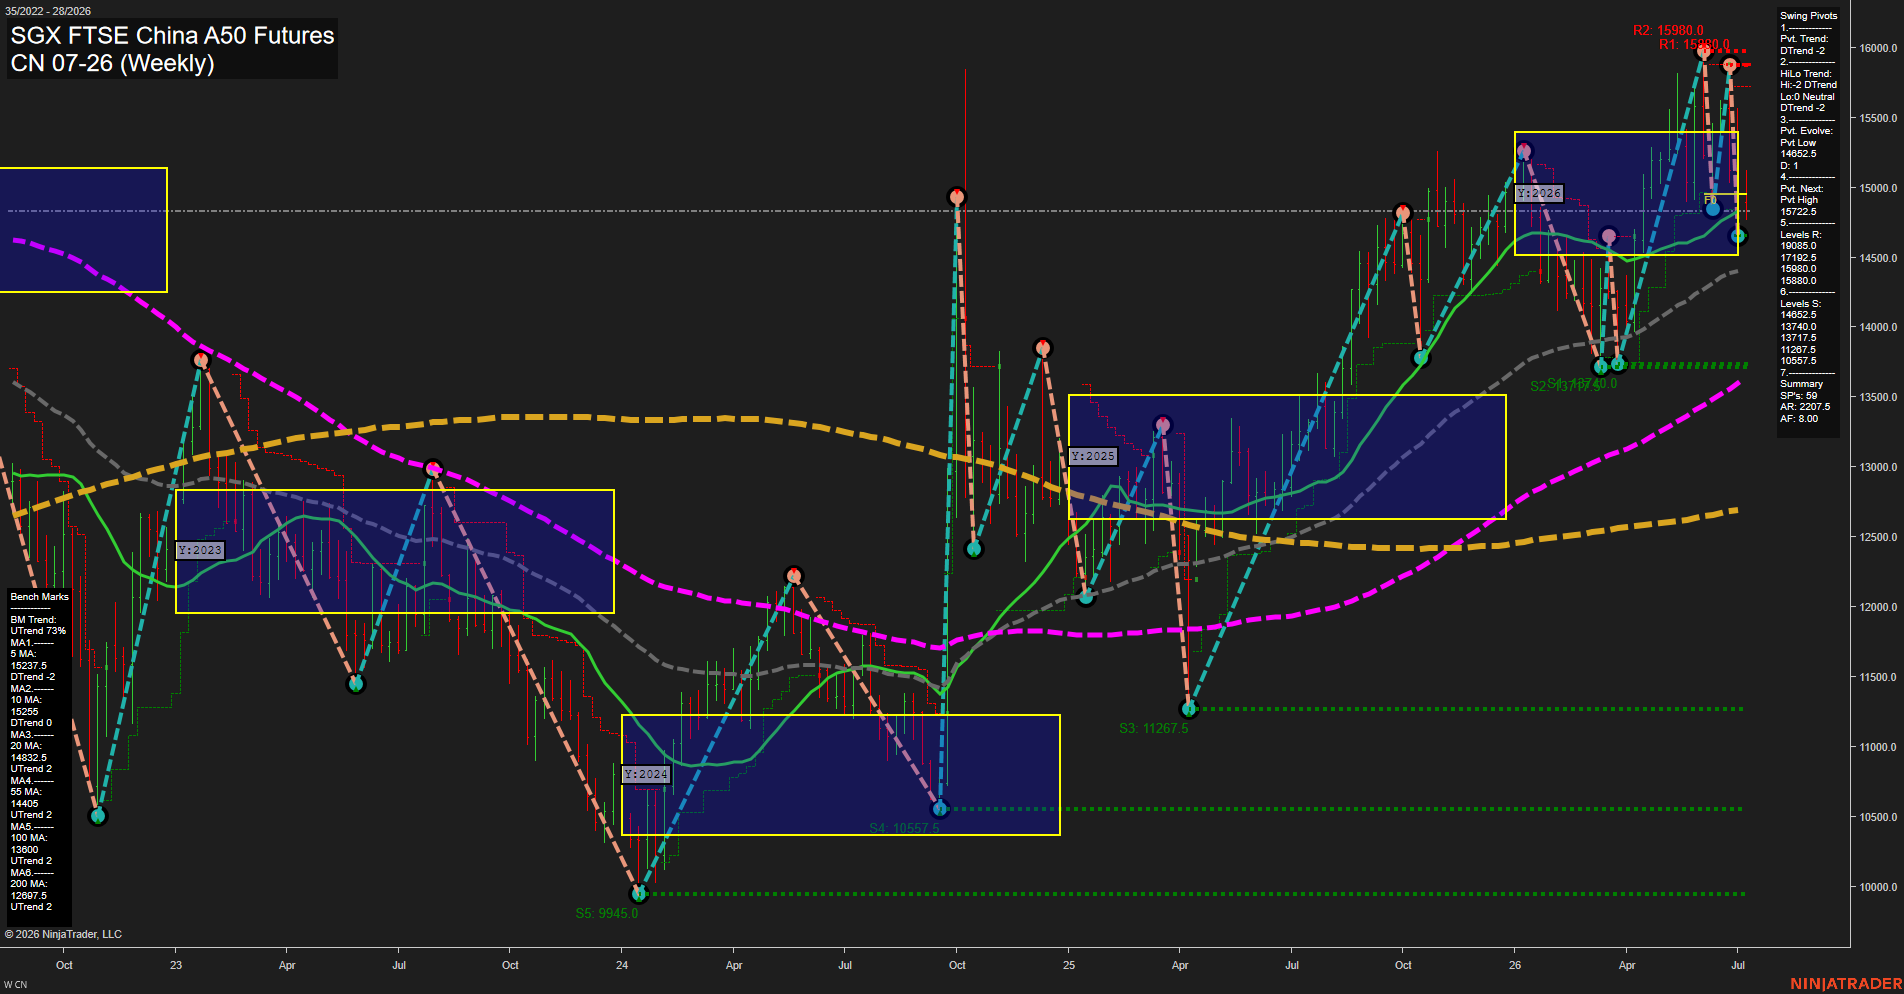
CN SGX FTSE China A50 Futures Weekly Chart Analysis: 2026-Jul-08 07:02 CT
Price Action
- Last: 14700,
- Bars: Large,
- Mom: Fast.
WSFG Weekly
- Short-Term
- WSFG Current: NA%
- F0%/NTZ' Bias: Price Neutral,
- WSFG Trend: Neutral.
MSFG Month Jul
- Intermediate-Term
- MSFG Current: NA%
- F0%/NTZ' Bias: Price Neutral,
- MSFG Trend: Neutral.
YSFG Year 2026
- Long-Term
- YSFG Current: NA%
- F0%/NTZ' Bias: Price Neutral,
- YSFG Trend: Neutral.
Swing Pivots
- (Short-Term) 1. Pvt. Trend: DTrend,
- (Intermediate-Term) 2. HiLo Trend: DTrend,
- 3. Pvt. Evolve: Pvt Low 14852.5,
- 4. Pvt. Next: Pvt High 15722.5,
- 5. Levels R: 19085.0, 17192.5, 15980.0, 15880.0,
- 6. Levels S: 14852.5, 13740.0, 13717.5, 11287.5, 10557.5.
Weekly Benchmarks
- (Short-Term) 5 Day: 15237.5 Down Trend,
- (Short-Term) 10 Day: 15255 Down Trend,
- (Intermediate-Term) 20 Day: 14832.5 Up Trend,
- (Intermediate-Term) 55 Day: 14405 Up Trend,
- (Long-Term) 100 Day: 13600 Up Trend,
- (Long-Term) 200 Day: 12807.5 Up Trend.
Overall Rating
- Short-Term: Bearish,
- Intermediate-Term: Neutral,
- Long-Term: Bullish.
Key Insights Summary
Weekly price is still operating inside a broad multi-year recovery structure, but the most recent swing sequence has rolled into a short-term down phase after testing the upper 2026 range. The pivot map shows a lower short-term trend with the next upside pivot set at 15722.5 and support layered at 14852.5, 13740.0, and 13717.5, creating a clear range framework. Price is below the 5 and 10 day benchmarks, which keeps the near-term tone soft, while the 20, 55, 100, and 200 day benchmarks remain in up trends, preserving the broader bullish backdrop. The chart is showing a classic pullback within a larger uptrend, with prior expansion phases followed by sharp retracements and rebound legs, so the current action reads as a consolidation-to-retracement phase rather than a full trend break.
Chart Analysis ATS AI Generated: 2026-07-08 07:02 for Informational use only, not trading advice. Terms and Risk Disclosure Copyright © 2026. Algo Trading Systems LLC.